Ghanaian vs Mongolian Average Family Size
COMPARE
Ghanaian
Mongolian
Average Family Size
Average Family Size Comparison
Ghanaians
Mongolians
3.29
AVERAGE FAMILY SIZE
98.0/ 100
METRIC RATING
107th/ 347
METRIC RANK
3.20
AVERAGE FAMILY SIZE
11.5/ 100
METRIC RATING
213th/ 347
METRIC RANK
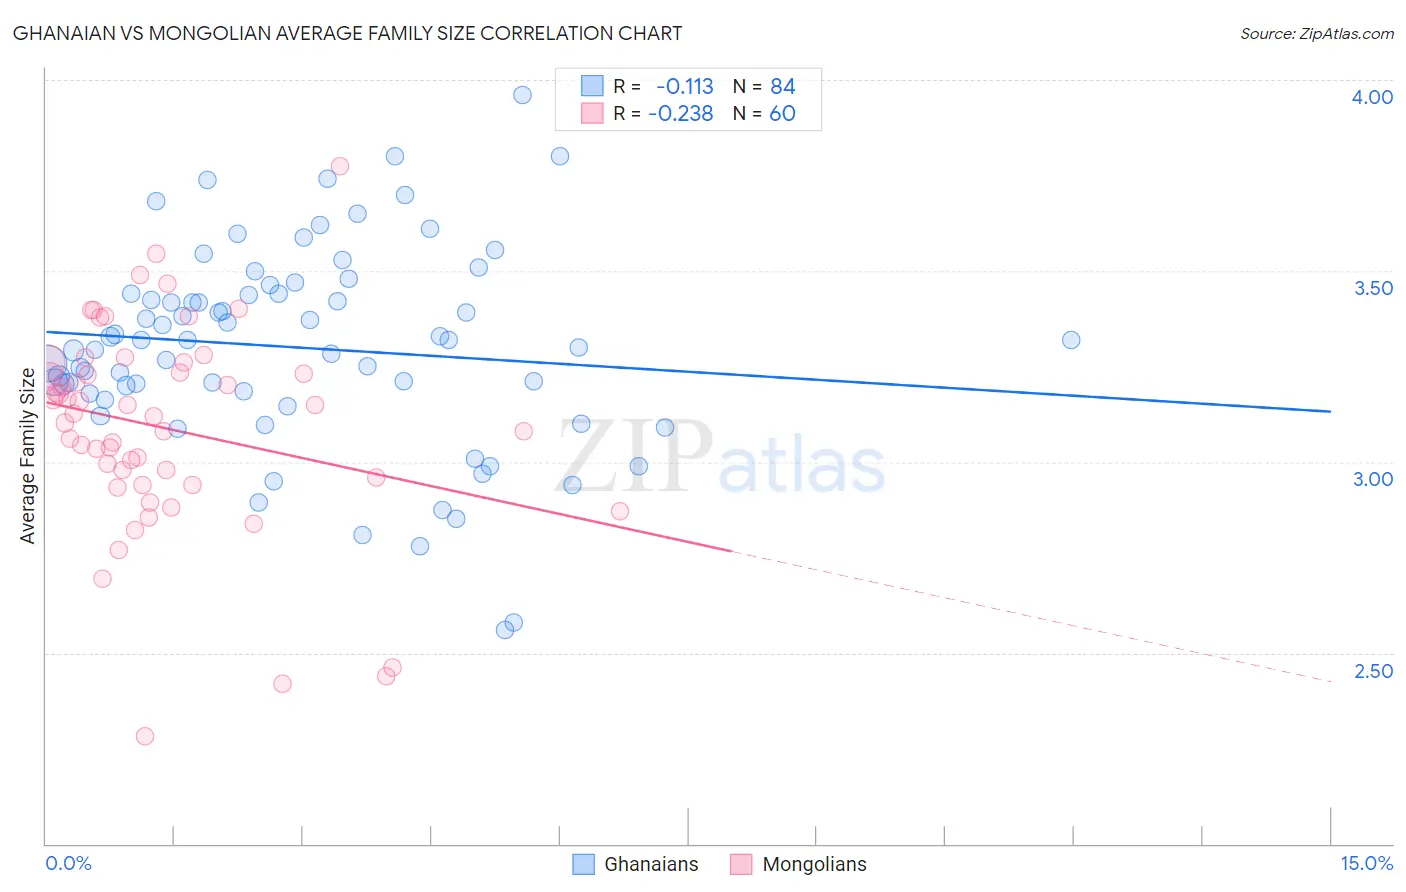
Ghanaian vs Mongolian Average Family Size Correlation Chart
The statistical analysis conducted on geographies consisting of 190,523,422 people shows a poor negative correlation between the proportion of Ghanaians and average family size in the United States with a correlation coefficient (R) of -0.113 and weighted average of 3.29. Similarly, the statistical analysis conducted on geographies consisting of 140,294,532 people shows a weak negative correlation between the proportion of Mongolians and average family size in the United States with a correlation coefficient (R) of -0.238 and weighted average of 3.20, a difference of 2.7%.
Average Family Size Correlation Summary
| Measurement | Ghanaian | Mongolian |
| Minimum | 2.56 | 2.28 |
| Maximum | 3.96 | 3.78 |
| Range | 1.40 | 1.50 |
| Mean | 3.30 | 3.09 |
| Median | 3.32 | 3.12 |
| Interquartile 25% (IQ1) | 3.18 | 2.95 |
| Interquartile 75% (IQ3) | 3.44 | 3.25 |
| Interquartile Range (IQR) | 0.26 | 0.30 |
| Standard Deviation (Sample) | 0.26 | 0.28 |
| Standard Deviation (Population) | 0.26 | 0.27 |
Similar Demographics by Average Family Size
Demographics Similar to Ghanaians by Average Family Size
In terms of average family size, the demographic groups most similar to Ghanaians are Paiute (3.29, a difference of 0.020%), Immigrants from Ghana (3.29, a difference of 0.030%), Bolivian (3.29, a difference of 0.090%), Immigrants from Western Africa (3.29, a difference of 0.12%), and West Indian (3.29, a difference of 0.15%).
| Demographics | Rating | Rank | Average Family Size |
| Guamanians/Chamorros | 98.6 /100 | #100 | Exceptional 3.29 |
| Immigrants | Burma/Myanmar | 98.6 /100 | #101 | Exceptional 3.29 |
| West Indians | 98.5 /100 | #102 | Exceptional 3.29 |
| Immigrants | Western Africa | 98.4 /100 | #103 | Exceptional 3.29 |
| Bolivians | 98.3 /100 | #104 | Exceptional 3.29 |
| Immigrants | Ghana | 98.1 /100 | #105 | Exceptional 3.29 |
| Paiute | 98.0 /100 | #106 | Exceptional 3.29 |
| Ghanaians | 98.0 /100 | #107 | Exceptional 3.29 |
| Asians | 97.0 /100 | #108 | Exceptional 3.28 |
| Puerto Ricans | 96.7 /100 | #109 | Exceptional 3.28 |
| Bahamians | 96.6 /100 | #110 | Exceptional 3.28 |
| Indonesians | 96.2 /100 | #111 | Exceptional 3.28 |
| Blacks/African Americans | 95.7 /100 | #112 | Exceptional 3.27 |
| Immigrants | Panama | 95.6 /100 | #113 | Exceptional 3.27 |
| South Americans | 95.1 /100 | #114 | Exceptional 3.27 |
Demographics Similar to Mongolians by Average Family Size
In terms of average family size, the demographic groups most similar to Mongolians are Immigrants from Iran (3.20, a difference of 0.020%), Creek (3.20, a difference of 0.020%), Somali (3.20, a difference of 0.020%), Delaware (3.20, a difference of 0.020%), and Bermudan (3.20, a difference of 0.030%).
| Demographics | Rating | Rank | Average Family Size |
| Immigrants | Cabo Verde | 16.0 /100 | #206 | Poor 3.20 |
| Filipinos | 13.6 /100 | #207 | Poor 3.20 |
| Chippewa | 13.3 /100 | #208 | Poor 3.20 |
| Sudanese | 13.3 /100 | #209 | Poor 3.20 |
| Zimbabweans | 12.6 /100 | #210 | Poor 3.20 |
| Immigrants | Iran | 12.1 /100 | #211 | Poor 3.20 |
| Creek | 12.1 /100 | #212 | Poor 3.20 |
| Mongolians | 11.5 /100 | #213 | Poor 3.20 |
| Somalis | 11.2 /100 | #214 | Poor 3.20 |
| Delaware | 11.1 /100 | #215 | Poor 3.20 |
| Bermudans | 11.0 /100 | #216 | Poor 3.20 |
| Immigrants | Somalia | 10.3 /100 | #217 | Poor 3.20 |
| French American Indians | 9.8 /100 | #218 | Tragic 3.20 |
| Pennsylvania Germans | 9.3 /100 | #219 | Tragic 3.19 |
| Lebanese | 9.1 /100 | #220 | Tragic 3.19 |