Ghanaian vs Immigrants from Western Africa Average Family Size
COMPARE
Ghanaian
Immigrants from Western Africa
Average Family Size
Average Family Size Comparison
Ghanaians
Immigrants from Western Africa
3.29
AVERAGE FAMILY SIZE
98.0/ 100
METRIC RATING
107th/ 347
METRIC RANK
3.29
AVERAGE FAMILY SIZE
98.4/ 100
METRIC RATING
103rd/ 347
METRIC RANK
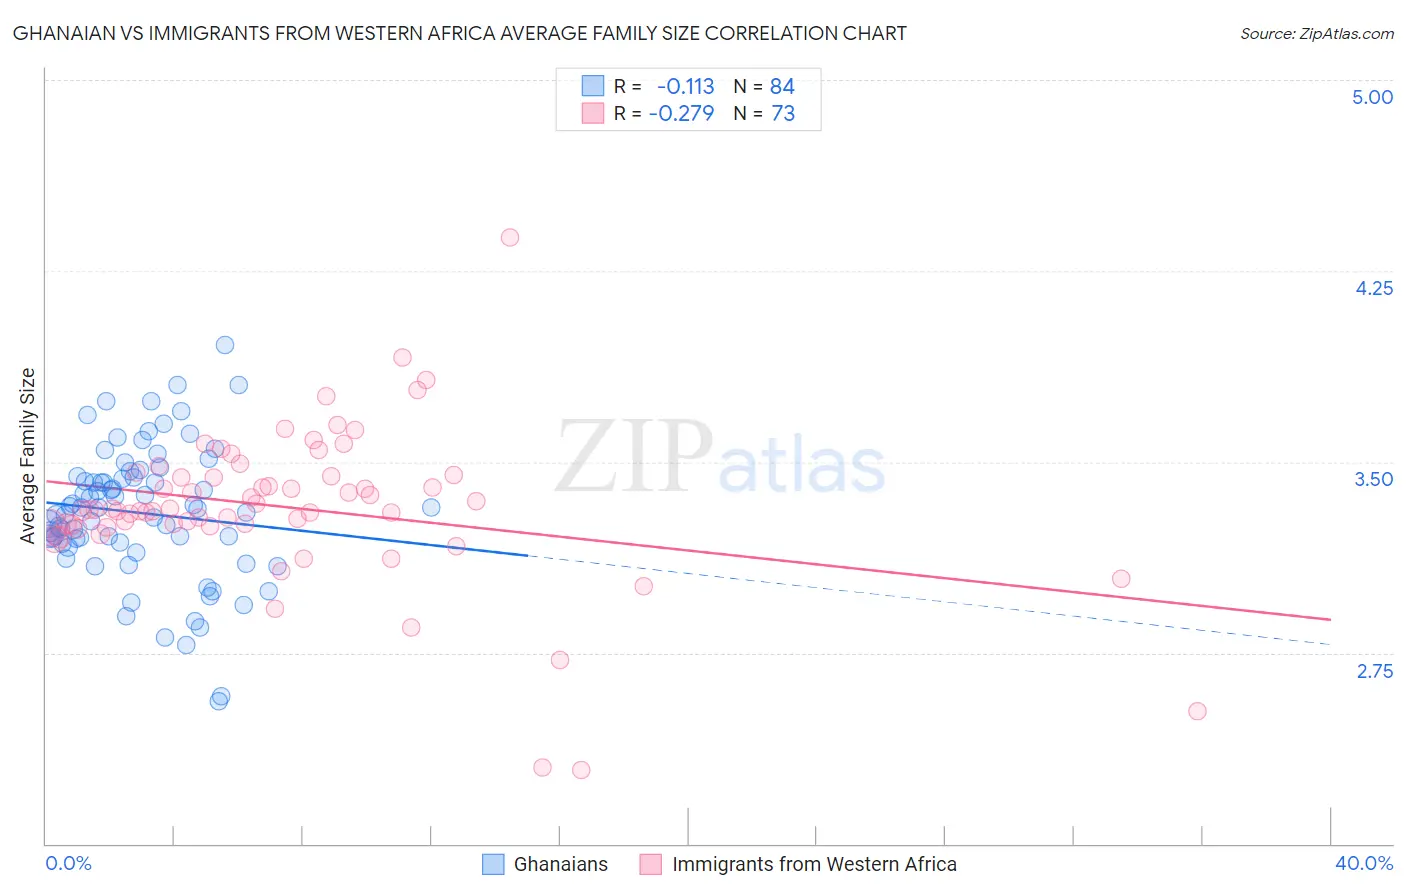
Ghanaian vs Immigrants from Western Africa Average Family Size Correlation Chart
The statistical analysis conducted on geographies consisting of 190,523,422 people shows a poor negative correlation between the proportion of Ghanaians and average family size in the United States with a correlation coefficient (R) of -0.113 and weighted average of 3.29. Similarly, the statistical analysis conducted on geographies consisting of 357,548,520 people shows a weak negative correlation between the proportion of Immigrants from Western Africa and average family size in the United States with a correlation coefficient (R) of -0.279 and weighted average of 3.29, a difference of 0.12%.
Average Family Size Correlation Summary
| Measurement | Ghanaian | Immigrants from Western Africa |
| Minimum | 2.56 | 2.29 |
| Maximum | 3.96 | 4.38 |
| Range | 1.40 | 2.09 |
| Mean | 3.30 | 3.32 |
| Median | 3.32 | 3.31 |
| Interquartile 25% (IQ1) | 3.18 | 3.24 |
| Interquartile 75% (IQ3) | 3.44 | 3.45 |
| Interquartile Range (IQR) | 0.26 | 0.20 |
| Standard Deviation (Sample) | 0.26 | 0.31 |
| Standard Deviation (Population) | 0.26 | 0.31 |
Demographics Similar to Ghanaians and Immigrants from Western Africa by Average Family Size
In terms of average family size, the demographic groups most similar to Ghanaians are Paiute (3.29, a difference of 0.020%), Immigrants from Ghana (3.29, a difference of 0.030%), Bolivian (3.29, a difference of 0.090%), West Indian (3.29, a difference of 0.15%), and Immigrants from Burma/Myanmar (3.29, a difference of 0.16%). Similarly, the demographic groups most similar to Immigrants from Western Africa are West Indian (3.29, a difference of 0.030%), Immigrants from Burma/Myanmar (3.29, a difference of 0.040%), Bolivian (3.29, a difference of 0.040%), Guamanian/Chamorro (3.29, a difference of 0.050%), and Immigrants from Oceania (3.29, a difference of 0.060%).
| Demographics | Rating | Rank | Average Family Size |
| Immigrants | Lebanon | 99.0 /100 | #95 | Exceptional 3.30 |
| U.S. Virgin Islanders | 98.8 /100 | #96 | Exceptional 3.29 |
| Immigrants | Oceania | 98.7 /100 | #97 | Exceptional 3.29 |
| Barbadians | 98.6 /100 | #98 | Exceptional 3.29 |
| Nigerians | 98.6 /100 | #99 | Exceptional 3.29 |
| Guamanians/Chamorros | 98.6 /100 | #100 | Exceptional 3.29 |
| Immigrants | Burma/Myanmar | 98.6 /100 | #101 | Exceptional 3.29 |
| West Indians | 98.5 /100 | #102 | Exceptional 3.29 |
| Immigrants | Western Africa | 98.4 /100 | #103 | Exceptional 3.29 |
| Bolivians | 98.3 /100 | #104 | Exceptional 3.29 |
| Immigrants | Ghana | 98.1 /100 | #105 | Exceptional 3.29 |
| Paiute | 98.0 /100 | #106 | Exceptional 3.29 |
| Ghanaians | 98.0 /100 | #107 | Exceptional 3.29 |
| Asians | 97.0 /100 | #108 | Exceptional 3.28 |
| Puerto Ricans | 96.7 /100 | #109 | Exceptional 3.28 |
| Bahamians | 96.6 /100 | #110 | Exceptional 3.28 |
| Indonesians | 96.2 /100 | #111 | Exceptional 3.28 |
| Blacks/African Americans | 95.7 /100 | #112 | Exceptional 3.27 |
| Immigrants | Panama | 95.6 /100 | #113 | Exceptional 3.27 |
| South Americans | 95.1 /100 | #114 | Exceptional 3.27 |
| Immigrants | Liberia | 95.0 /100 | #115 | Exceptional 3.27 |