Ghanaian vs Immigrants from Bahamas Average Family Size
COMPARE
Ghanaian
Immigrants from Bahamas
Average Family Size
Average Family Size Comparison
Ghanaians
Immigrants from Bahamas
3.29
AVERAGE FAMILY SIZE
98.0/ 100
METRIC RATING
107th/ 347
METRIC RANK
3.27
AVERAGE FAMILY SIZE
93.6/ 100
METRIC RATING
120th/ 347
METRIC RANK
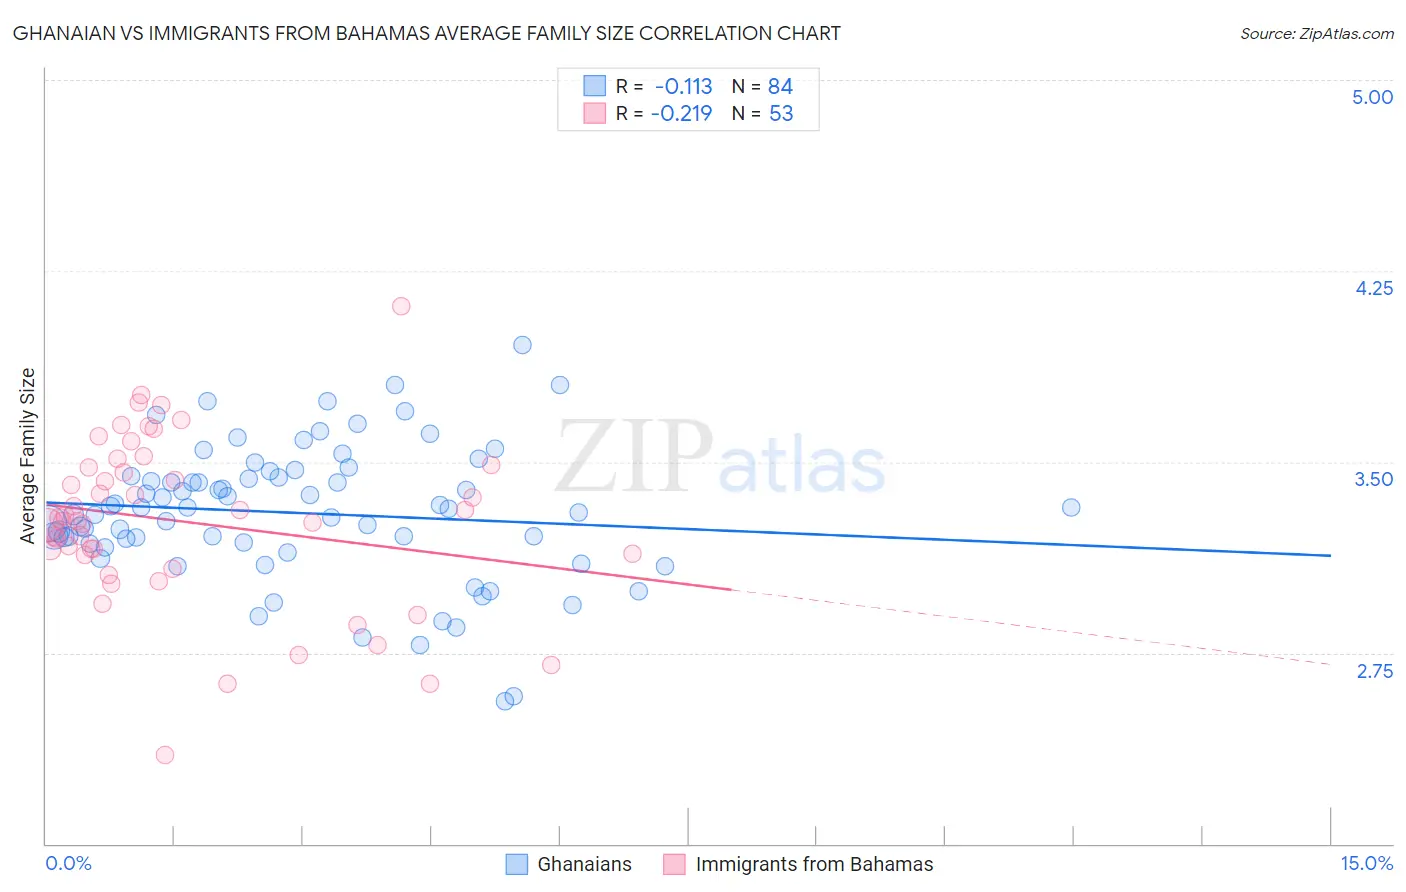
Ghanaian vs Immigrants from Bahamas Average Family Size Correlation Chart
The statistical analysis conducted on geographies consisting of 190,523,422 people shows a poor negative correlation between the proportion of Ghanaians and average family size in the United States with a correlation coefficient (R) of -0.113 and weighted average of 3.29. Similarly, the statistical analysis conducted on geographies consisting of 104,605,008 people shows a weak negative correlation between the proportion of Immigrants from Bahamas and average family size in the United States with a correlation coefficient (R) of -0.219 and weighted average of 3.27, a difference of 0.54%.
Average Family Size Correlation Summary
| Measurement | Ghanaian | Immigrants from Bahamas |
| Minimum | 2.56 | 2.35 |
| Maximum | 3.96 | 4.11 |
| Range | 1.40 | 1.76 |
| Mean | 3.30 | 3.26 |
| Median | 3.32 | 3.27 |
| Interquartile 25% (IQ1) | 3.18 | 3.11 |
| Interquartile 75% (IQ3) | 3.44 | 3.48 |
| Interquartile Range (IQR) | 0.26 | 0.38 |
| Standard Deviation (Sample) | 0.26 | 0.33 |
| Standard Deviation (Population) | 0.26 | 0.33 |
Demographics Similar to Ghanaians and Immigrants from Bahamas by Average Family Size
In terms of average family size, the demographic groups most similar to Ghanaians are Paiute (3.29, a difference of 0.020%), Immigrants from Ghana (3.29, a difference of 0.030%), Bolivian (3.29, a difference of 0.090%), Immigrants from Western Africa (3.29, a difference of 0.12%), and Asian (3.28, a difference of 0.17%). Similarly, the demographic groups most similar to Immigrants from Bahamas are Immigrants from Indonesia (3.27, a difference of 0.010%), Immigrants from Thailand (3.27, a difference of 0.020%), Immigrants from Asia (3.27, a difference of 0.030%), Immigrants from Colombia (3.27, a difference of 0.060%), and Alaskan Athabascan (3.27, a difference of 0.080%).
| Demographics | Rating | Rank | Average Family Size |
| Immigrants | Western Africa | 98.4 /100 | #103 | Exceptional 3.29 |
| Bolivians | 98.3 /100 | #104 | Exceptional 3.29 |
| Immigrants | Ghana | 98.1 /100 | #105 | Exceptional 3.29 |
| Paiute | 98.0 /100 | #106 | Exceptional 3.29 |
| Ghanaians | 98.0 /100 | #107 | Exceptional 3.29 |
| Asians | 97.0 /100 | #108 | Exceptional 3.28 |
| Puerto Ricans | 96.7 /100 | #109 | Exceptional 3.28 |
| Bahamians | 96.6 /100 | #110 | Exceptional 3.28 |
| Indonesians | 96.2 /100 | #111 | Exceptional 3.28 |
| Blacks/African Americans | 95.7 /100 | #112 | Exceptional 3.27 |
| Immigrants | Panama | 95.6 /100 | #113 | Exceptional 3.27 |
| South Americans | 95.1 /100 | #114 | Exceptional 3.27 |
| Immigrants | Liberia | 95.0 /100 | #115 | Exceptional 3.27 |
| Immigrants | South America | 95.0 /100 | #116 | Exceptional 3.27 |
| Kiowa | 94.8 /100 | #117 | Exceptional 3.27 |
| Immigrants | Asia | 94.0 /100 | #118 | Exceptional 3.27 |
| Immigrants | Indonesia | 93.7 /100 | #119 | Exceptional 3.27 |
| Immigrants | Bahamas | 93.6 /100 | #120 | Exceptional 3.27 |
| Immigrants | Thailand | 93.3 /100 | #121 | Exceptional 3.27 |
| Immigrants | Colombia | 92.8 /100 | #122 | Exceptional 3.27 |
| Alaskan Athabascans | 92.4 /100 | #123 | Exceptional 3.27 |