French vs Immigrants from Africa Divorced or Separated
COMPARE
French
Immigrants from Africa
Divorced or Separated
Divorced or Separated Comparison
French
Immigrants from Africa
12.8%
DIVORCED OR SEPARATED
0.1/ 100
METRIC RATING
285th/ 347
METRIC RANK
12.1%
DIVORCED OR SEPARATED
30.3/ 100
METRIC RATING
197th/ 347
METRIC RANK
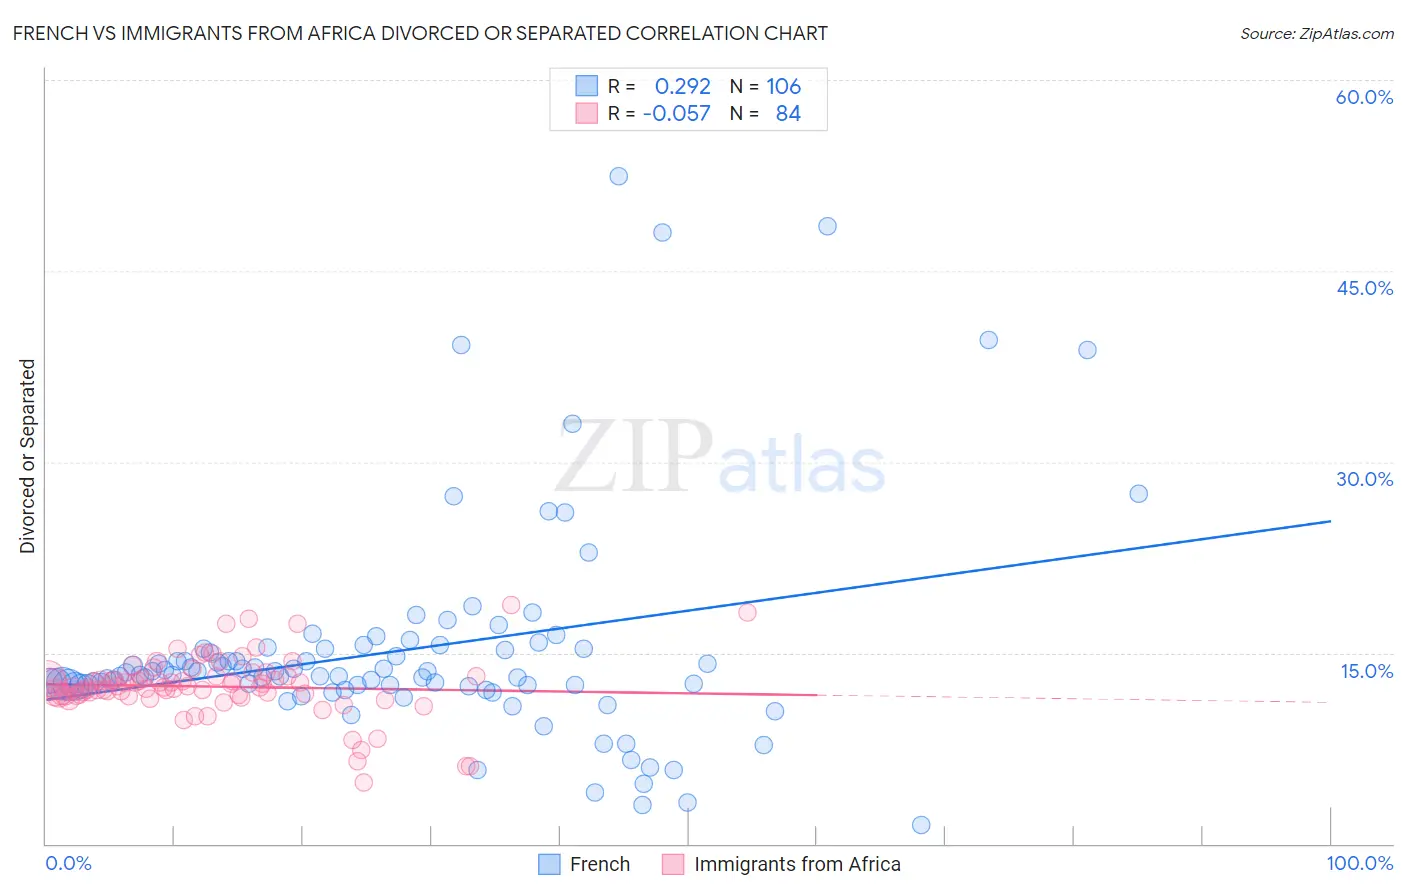
French vs Immigrants from Africa Divorced or Separated Correlation Chart
The statistical analysis conducted on geographies consisting of 571,939,764 people shows a weak positive correlation between the proportion of French and percentage of population currently divorced or separated in the United States with a correlation coefficient (R) of 0.292 and weighted average of 12.8%. Similarly, the statistical analysis conducted on geographies consisting of 469,119,940 people shows a slight negative correlation between the proportion of Immigrants from Africa and percentage of population currently divorced or separated in the United States with a correlation coefficient (R) of -0.057 and weighted average of 12.1%, a difference of 5.1%.
Divorced or Separated Correlation Summary
| Measurement | French | Immigrants from Africa |
| Minimum | 1.5% | 4.8% |
| Maximum | 52.4% | 18.8% |
| Range | 50.9% | 14.0% |
| Mean | 15.2% | 12.4% |
| Median | 13.3% | 12.3% |
| Interquartile 25% (IQ1) | 12.4% | 11.7% |
| Interquartile 75% (IQ3) | 15.3% | 13.1% |
| Interquartile Range (IQR) | 2.9% | 1.5% |
| Standard Deviation (Sample) | 8.7% | 2.4% |
| Standard Deviation (Population) | 8.6% | 2.4% |
Similar Demographics by Divorced or Separated
Demographics Similar to French by Divorced or Separated
In terms of divorced or separated, the demographic groups most similar to French are Nonimmigrants (12.8%, a difference of 0.040%), Delaware (12.7%, a difference of 0.13%), Subsaharan African (12.7%, a difference of 0.14%), Spanish (12.8%, a difference of 0.23%), and Pueblo (12.7%, a difference of 0.26%).
| Demographics | Rating | Rank | Divorced or Separated |
| Lumbee | 0.2 /100 | #278 | Tragic 12.7% |
| Immigrants | Dominican Republic | 0.2 /100 | #279 | Tragic 12.7% |
| Immigrants | Zaire | 0.2 /100 | #280 | Tragic 12.7% |
| Pueblo | 0.2 /100 | #281 | Tragic 12.7% |
| Sub-Saharan Africans | 0.1 /100 | #282 | Tragic 12.7% |
| Delaware | 0.1 /100 | #283 | Tragic 12.7% |
| Immigrants | Nonimmigrants | 0.1 /100 | #284 | Tragic 12.8% |
| French | 0.1 /100 | #285 | Tragic 12.8% |
| Spanish | 0.1 /100 | #286 | Tragic 12.8% |
| Hondurans | 0.1 /100 | #287 | Tragic 12.8% |
| French Canadians | 0.1 /100 | #288 | Tragic 12.8% |
| Iroquois | 0.0 /100 | #289 | Tragic 12.9% |
| Pima | 0.0 /100 | #290 | Tragic 12.9% |
| Immigrants | Honduras | 0.0 /100 | #291 | Tragic 12.9% |
| Scotch-Irish | 0.0 /100 | #292 | Tragic 12.9% |
Demographics Similar to Immigrants from Africa by Divorced or Separated
In terms of divorced or separated, the demographic groups most similar to Immigrants from Africa are Immigrants from Burma/Myanmar (12.1%, a difference of 0.0%), Nigerian (12.1%, a difference of 0.010%), Immigrants from England (12.1%, a difference of 0.040%), Central American (12.1%, a difference of 0.040%), and Immigrants from Eritrea (12.1%, a difference of 0.060%).
| Demographics | Rating | Rank | Divorced or Separated |
| Moroccans | 34.8 /100 | #190 | Fair 12.1% |
| Swedes | 34.4 /100 | #191 | Fair 12.1% |
| Norwegians | 33.2 /100 | #192 | Fair 12.1% |
| Immigrants | Thailand | 32.5 /100 | #193 | Fair 12.1% |
| Immigrants | Eritrea | 31.9 /100 | #194 | Fair 12.1% |
| Immigrants | England | 31.4 /100 | #195 | Fair 12.1% |
| Immigrants | Burma/Myanmar | 30.4 /100 | #196 | Fair 12.1% |
| Immigrants | Africa | 30.3 /100 | #197 | Fair 12.1% |
| Nigerians | 30.1 /100 | #198 | Fair 12.1% |
| Central Americans | 29.4 /100 | #199 | Fair 12.1% |
| South Americans | 28.6 /100 | #200 | Fair 12.2% |
| Guatemalans | 26.9 /100 | #201 | Fair 12.2% |
| Portuguese | 23.5 /100 | #202 | Fair 12.2% |
| Immigrants | Guatemala | 23.2 /100 | #203 | Fair 12.2% |
| Kenyans | 21.8 /100 | #204 | Fair 12.2% |