Welsh vs Immigrants from Africa Divorced or Separated
COMPARE
Welsh
Immigrants from Africa
Divorced or Separated
Divorced or Separated Comparison
Welsh
Immigrants from Africa
12.6%
DIVORCED OR SEPARATED
0.7/ 100
METRIC RATING
255th/ 347
METRIC RANK
12.1%
DIVORCED OR SEPARATED
30.3/ 100
METRIC RATING
197th/ 347
METRIC RANK
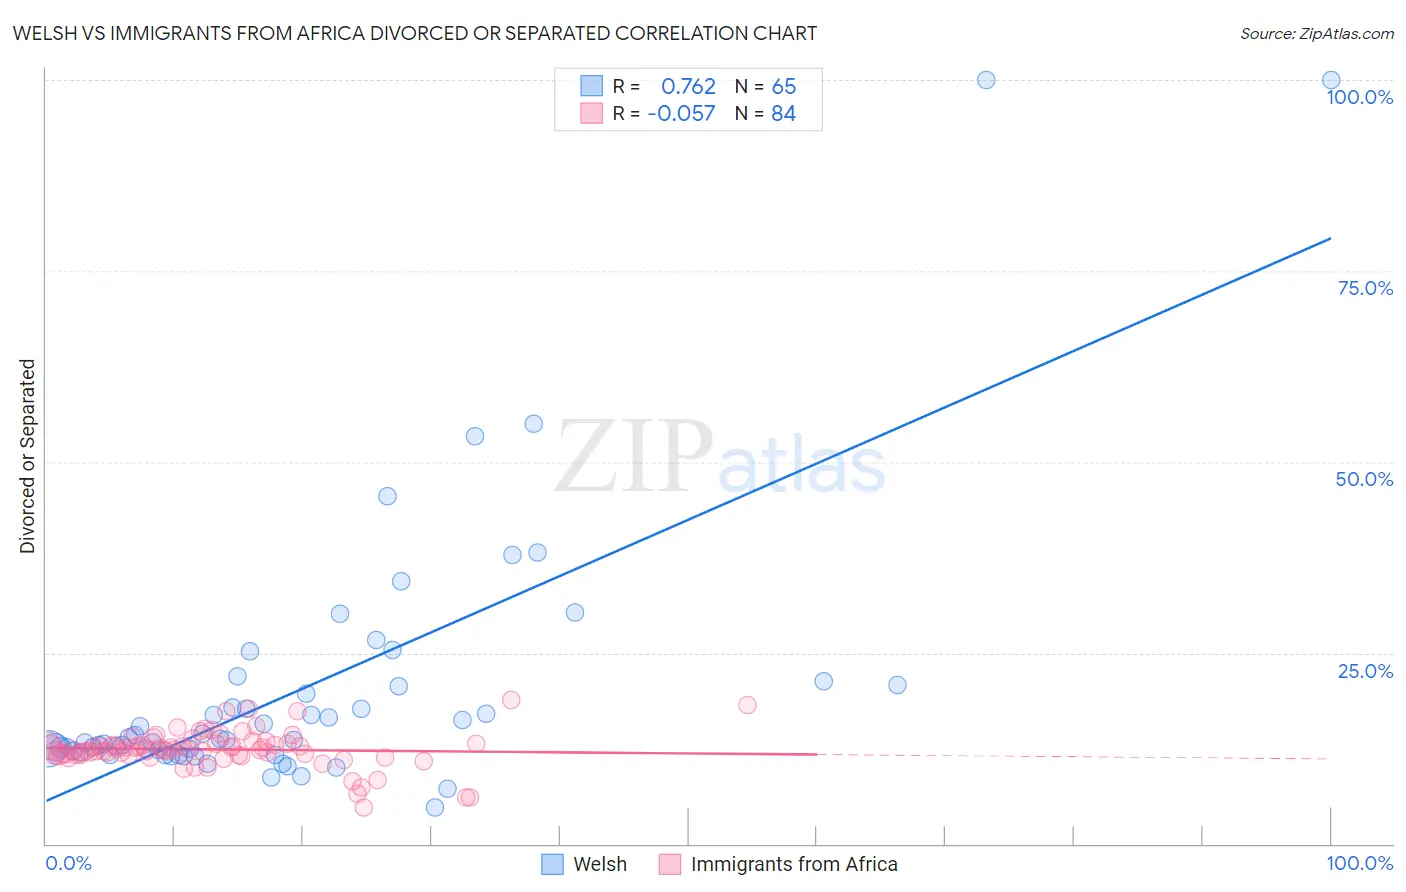
Welsh vs Immigrants from Africa Divorced or Separated Correlation Chart
The statistical analysis conducted on geographies consisting of 528,296,815 people shows a strong positive correlation between the proportion of Welsh and percentage of population currently divorced or separated in the United States with a correlation coefficient (R) of 0.762 and weighted average of 12.6%. Similarly, the statistical analysis conducted on geographies consisting of 469,119,940 people shows a slight negative correlation between the proportion of Immigrants from Africa and percentage of population currently divorced or separated in the United States with a correlation coefficient (R) of -0.057 and weighted average of 12.1%, a difference of 3.5%.
Divorced or Separated Correlation Summary
| Measurement | Welsh | Immigrants from Africa |
| Minimum | 4.7% | 4.8% |
| Maximum | 100.0% | 18.8% |
| Range | 95.3% | 14.0% |
| Mean | 20.2% | 12.4% |
| Median | 13.5% | 12.3% |
| Interquartile 25% (IQ1) | 12.1% | 11.7% |
| Interquartile 75% (IQ3) | 20.7% | 13.1% |
| Interquartile Range (IQR) | 8.6% | 1.5% |
| Standard Deviation (Sample) | 17.5% | 2.4% |
| Standard Deviation (Population) | 17.4% | 2.4% |
Similar Demographics by Divorced or Separated
Demographics Similar to Welsh by Divorced or Separated
In terms of divorced or separated, the demographic groups most similar to Welsh are Senegalese (12.6%, a difference of 0.10%), Liberian (12.6%, a difference of 0.16%), Somali (12.6%, a difference of 0.16%), Immigrants from Colombia (12.6%, a difference of 0.16%), and Immigrants from Somalia (12.6%, a difference of 0.17%).
| Demographics | Rating | Rank | Divorced or Separated |
| Nepalese | 1.8 /100 | #248 | Tragic 12.5% |
| Finns | 1.8 /100 | #249 | Tragic 12.5% |
| Irish | 1.3 /100 | #250 | Tragic 12.5% |
| Aleuts | 1.3 /100 | #251 | Tragic 12.5% |
| Liberians | 0.9 /100 | #252 | Tragic 12.6% |
| Somalis | 0.9 /100 | #253 | Tragic 12.6% |
| Senegalese | 0.8 /100 | #254 | Tragic 12.6% |
| Welsh | 0.7 /100 | #255 | Tragic 12.6% |
| Immigrants | Colombia | 0.6 /100 | #256 | Tragic 12.6% |
| Immigrants | Somalia | 0.6 /100 | #257 | Tragic 12.6% |
| Indonesians | 0.6 /100 | #258 | Tragic 12.6% |
| Yuman | 0.6 /100 | #259 | Tragic 12.6% |
| Immigrants | Uruguay | 0.6 /100 | #260 | Tragic 12.6% |
| Immigrants | Dominica | 0.5 /100 | #261 | Tragic 12.6% |
| Basques | 0.5 /100 | #262 | Tragic 12.6% |
Demographics Similar to Immigrants from Africa by Divorced or Separated
In terms of divorced or separated, the demographic groups most similar to Immigrants from Africa are Immigrants from Burma/Myanmar (12.1%, a difference of 0.0%), Nigerian (12.1%, a difference of 0.010%), Immigrants from England (12.1%, a difference of 0.040%), Central American (12.1%, a difference of 0.040%), and Immigrants from Eritrea (12.1%, a difference of 0.060%).
| Demographics | Rating | Rank | Divorced or Separated |
| Moroccans | 34.8 /100 | #190 | Fair 12.1% |
| Swedes | 34.4 /100 | #191 | Fair 12.1% |
| Norwegians | 33.2 /100 | #192 | Fair 12.1% |
| Immigrants | Thailand | 32.5 /100 | #193 | Fair 12.1% |
| Immigrants | Eritrea | 31.9 /100 | #194 | Fair 12.1% |
| Immigrants | England | 31.4 /100 | #195 | Fair 12.1% |
| Immigrants | Burma/Myanmar | 30.4 /100 | #196 | Fair 12.1% |
| Immigrants | Africa | 30.3 /100 | #197 | Fair 12.1% |
| Nigerians | 30.1 /100 | #198 | Fair 12.1% |
| Central Americans | 29.4 /100 | #199 | Fair 12.1% |
| South Americans | 28.6 /100 | #200 | Fair 12.2% |
| Guatemalans | 26.9 /100 | #201 | Fair 12.2% |
| Portuguese | 23.5 /100 | #202 | Fair 12.2% |
| Immigrants | Guatemala | 23.2 /100 | #203 | Fair 12.2% |
| Kenyans | 21.8 /100 | #204 | Fair 12.2% |