Egyptian vs Immigrants from Africa Divorced or Separated
COMPARE
Egyptian
Immigrants from Africa
Divorced or Separated
Divorced or Separated Comparison
Egyptians
Immigrants from Africa
11.1%
DIVORCED OR SEPARATED
100.0/ 100
METRIC RATING
33rd/ 347
METRIC RANK
12.1%
DIVORCED OR SEPARATED
30.3/ 100
METRIC RATING
197th/ 347
METRIC RANK
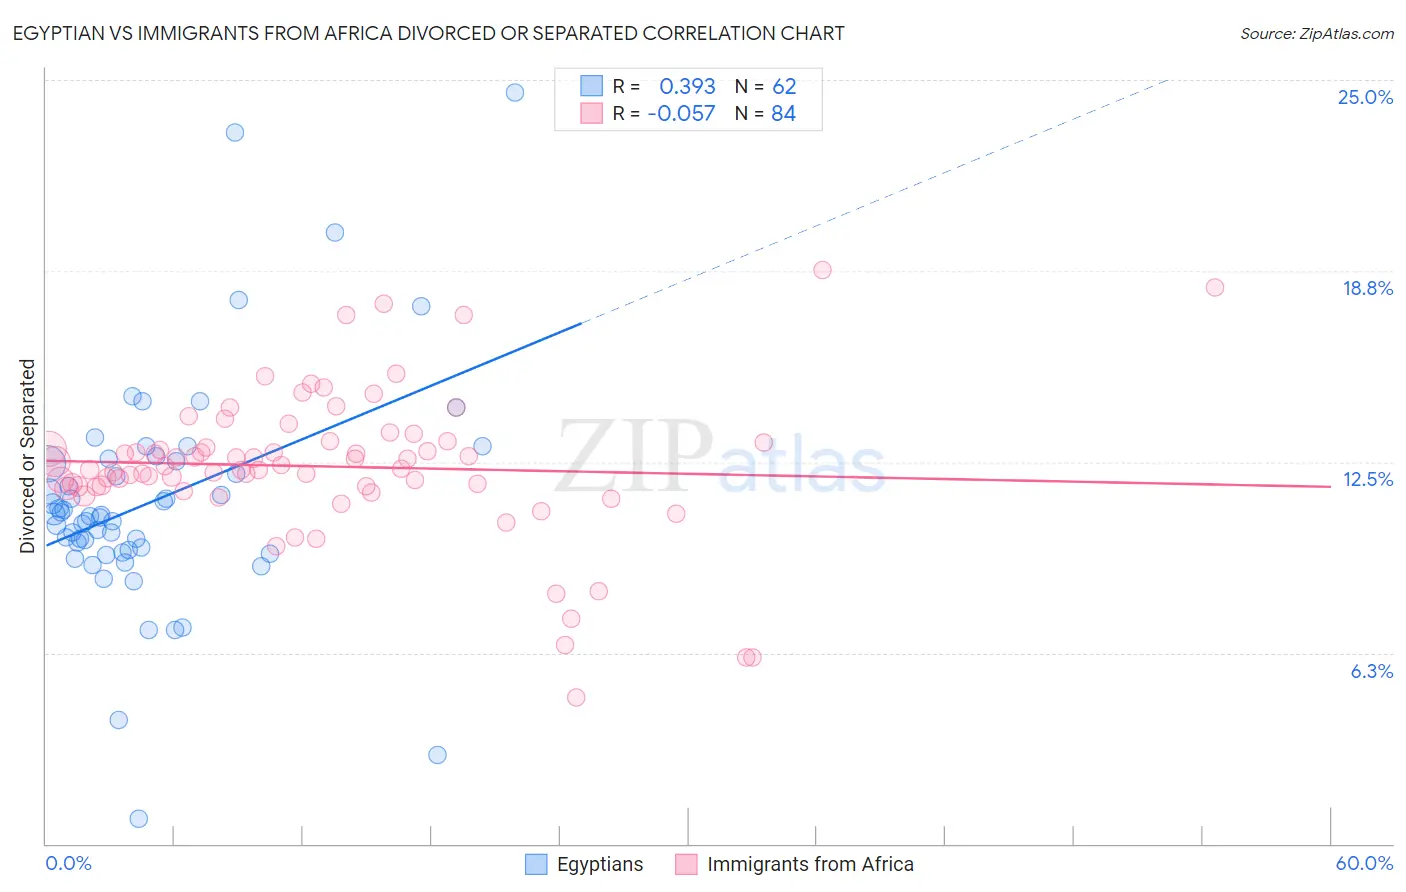
Egyptian vs Immigrants from Africa Divorced or Separated Correlation Chart
The statistical analysis conducted on geographies consisting of 276,808,669 people shows a mild positive correlation between the proportion of Egyptians and percentage of population currently divorced or separated in the United States with a correlation coefficient (R) of 0.393 and weighted average of 11.1%. Similarly, the statistical analysis conducted on geographies consisting of 469,119,940 people shows a slight negative correlation between the proportion of Immigrants from Africa and percentage of population currently divorced or separated in the United States with a correlation coefficient (R) of -0.057 and weighted average of 12.1%, a difference of 9.6%.
Divorced or Separated Correlation Summary
| Measurement | Egyptian | Immigrants from Africa |
| Minimum | 0.80% | 4.8% |
| Maximum | 24.6% | 18.8% |
| Range | 23.8% | 14.0% |
| Mean | 11.2% | 12.4% |
| Median | 10.8% | 12.3% |
| Interquartile 25% (IQ1) | 9.6% | 11.7% |
| Interquartile 75% (IQ3) | 12.5% | 13.1% |
| Interquartile Range (IQR) | 2.9% | 1.5% |
| Standard Deviation (Sample) | 3.8% | 2.4% |
| Standard Deviation (Population) | 3.8% | 2.4% |
Similar Demographics by Divorced or Separated
Demographics Similar to Egyptians by Divorced or Separated
In terms of divorced or separated, the demographic groups most similar to Egyptians are Tongan (11.1%, a difference of 0.040%), Immigrants from Uzbekistan (11.1%, a difference of 0.070%), Mongolian (11.1%, a difference of 0.12%), Cambodian (11.1%, a difference of 0.15%), and Immigrants from Japan (11.1%, a difference of 0.21%).
| Demographics | Rating | Rank | Divorced or Separated |
| Immigrants | Indonesia | 100.0 /100 | #26 | Exceptional 10.9% |
| Immigrants | Bangladesh | 100.0 /100 | #27 | Exceptional 11.0% |
| Immigrants | Malaysia | 100.0 /100 | #28 | Exceptional 11.0% |
| Armenians | 100.0 /100 | #29 | Exceptional 11.0% |
| Immigrants | Ireland | 100.0 /100 | #30 | Exceptional 11.0% |
| Mongolians | 100.0 /100 | #31 | Exceptional 11.1% |
| Tongans | 100.0 /100 | #32 | Exceptional 11.1% |
| Egyptians | 100.0 /100 | #33 | Exceptional 11.1% |
| Immigrants | Uzbekistan | 100.0 /100 | #34 | Exceptional 11.1% |
| Cambodians | 100.0 /100 | #35 | Exceptional 11.1% |
| Immigrants | Japan | 100.0 /100 | #36 | Exceptional 11.1% |
| Immigrants | Lebanon | 100.0 /100 | #37 | Exceptional 11.1% |
| Immigrants | Greece | 100.0 /100 | #38 | Exceptional 11.1% |
| Immigrants | Egypt | 100.0 /100 | #39 | Exceptional 11.1% |
| Soviet Union | 100.0 /100 | #40 | Exceptional 11.1% |
Demographics Similar to Immigrants from Africa by Divorced or Separated
In terms of divorced or separated, the demographic groups most similar to Immigrants from Africa are Immigrants from Burma/Myanmar (12.1%, a difference of 0.0%), Nigerian (12.1%, a difference of 0.010%), Immigrants from England (12.1%, a difference of 0.040%), Central American (12.1%, a difference of 0.040%), and Immigrants from Eritrea (12.1%, a difference of 0.060%).
| Demographics | Rating | Rank | Divorced or Separated |
| Moroccans | 34.8 /100 | #190 | Fair 12.1% |
| Swedes | 34.4 /100 | #191 | Fair 12.1% |
| Norwegians | 33.2 /100 | #192 | Fair 12.1% |
| Immigrants | Thailand | 32.5 /100 | #193 | Fair 12.1% |
| Immigrants | Eritrea | 31.9 /100 | #194 | Fair 12.1% |
| Immigrants | England | 31.4 /100 | #195 | Fair 12.1% |
| Immigrants | Burma/Myanmar | 30.4 /100 | #196 | Fair 12.1% |
| Immigrants | Africa | 30.3 /100 | #197 | Fair 12.1% |
| Nigerians | 30.1 /100 | #198 | Fair 12.1% |
| Central Americans | 29.4 /100 | #199 | Fair 12.1% |
| South Americans | 28.6 /100 | #200 | Fair 12.2% |
| Guatemalans | 26.9 /100 | #201 | Fair 12.2% |
| Portuguese | 23.5 /100 | #202 | Fair 12.2% |
| Immigrants | Guatemala | 23.2 /100 | #203 | Fair 12.2% |
| Kenyans | 21.8 /100 | #204 | Fair 12.2% |