French vs Immigrants from Italy Divorced or Separated
COMPARE
French
Immigrants from Italy
Divorced or Separated
Divorced or Separated Comparison
French
Immigrants from Italy
12.8%
DIVORCED OR SEPARATED
0.1/ 100
METRIC RATING
285th/ 347
METRIC RANK
11.5%
DIVORCED OR SEPARATED
99.5/ 100
METRIC RATING
77th/ 347
METRIC RANK
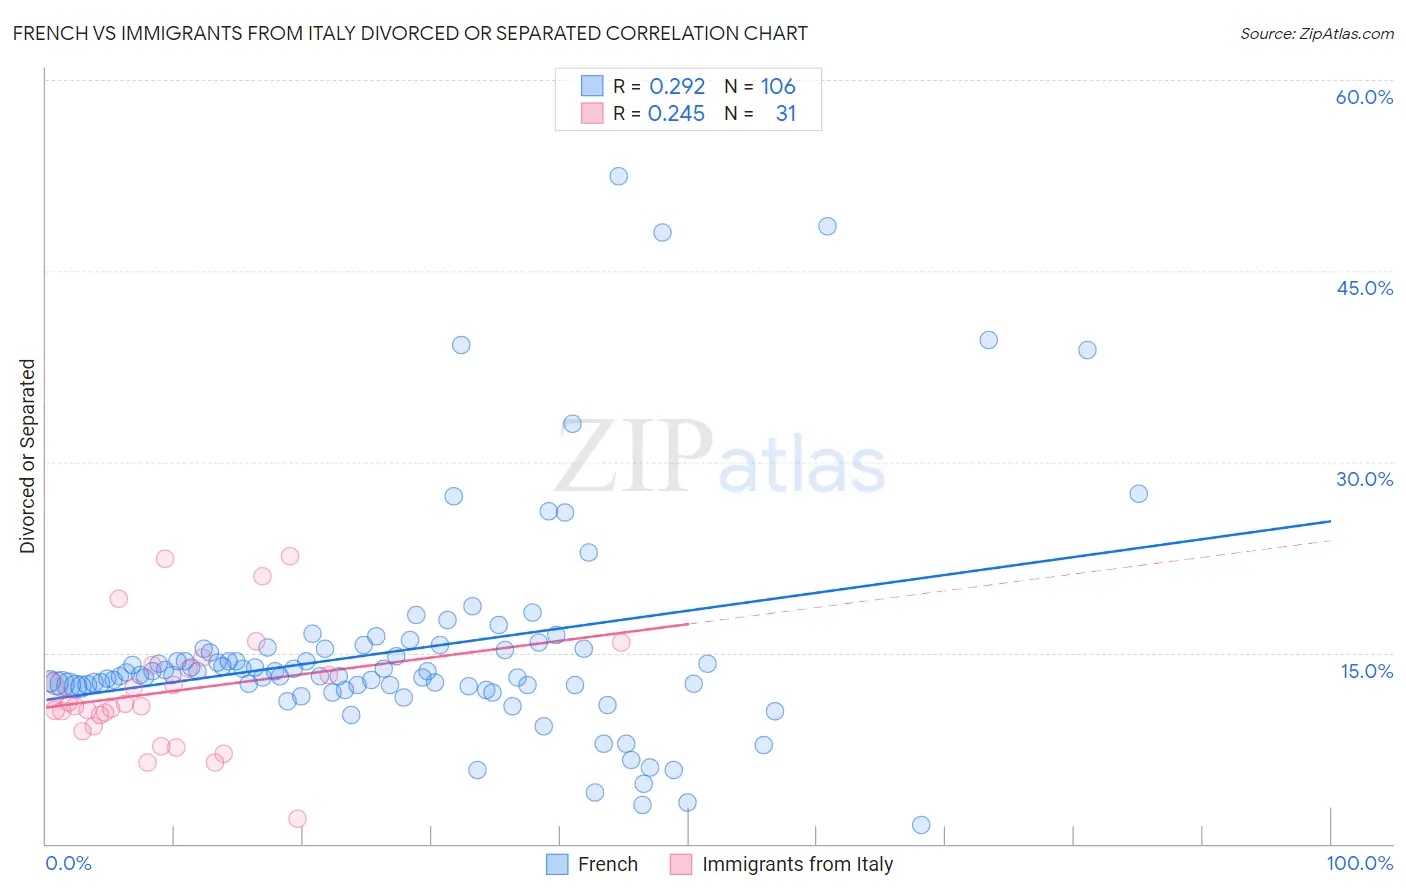
French vs Immigrants from Italy Divorced or Separated Correlation Chart
The statistical analysis conducted on geographies consisting of 571,939,764 people shows a weak positive correlation between the proportion of French and percentage of population currently divorced or separated in the United States with a correlation coefficient (R) of 0.292 and weighted average of 12.8%. Similarly, the statistical analysis conducted on geographies consisting of 324,175,792 people shows a weak positive correlation between the proportion of Immigrants from Italy and percentage of population currently divorced or separated in the United States with a correlation coefficient (R) of 0.245 and weighted average of 11.5%, a difference of 10.9%.
Divorced or Separated Correlation Summary
| Measurement | French | Immigrants from Italy |
| Minimum | 1.5% | 2.0% |
| Maximum | 52.4% | 22.6% |
| Range | 50.9% | 20.6% |
| Mean | 15.2% | 12.0% |
| Median | 13.3% | 10.8% |
| Interquartile 25% (IQ1) | 12.4% | 9.2% |
| Interquartile 75% (IQ3) | 15.3% | 14.1% |
| Interquartile Range (IQR) | 2.9% | 4.9% |
| Standard Deviation (Sample) | 8.7% | 4.7% |
| Standard Deviation (Population) | 8.6% | 4.6% |
Similar Demographics by Divorced or Separated
Demographics Similar to French by Divorced or Separated
In terms of divorced or separated, the demographic groups most similar to French are Nonimmigrants (12.8%, a difference of 0.040%), Delaware (12.7%, a difference of 0.13%), Subsaharan African (12.7%, a difference of 0.14%), Spanish (12.8%, a difference of 0.23%), and Pueblo (12.7%, a difference of 0.26%).
| Demographics | Rating | Rank | Divorced or Separated |
| Lumbee | 0.2 /100 | #278 | Tragic 12.7% |
| Immigrants | Dominican Republic | 0.2 /100 | #279 | Tragic 12.7% |
| Immigrants | Zaire | 0.2 /100 | #280 | Tragic 12.7% |
| Pueblo | 0.2 /100 | #281 | Tragic 12.7% |
| Sub-Saharan Africans | 0.1 /100 | #282 | Tragic 12.7% |
| Delaware | 0.1 /100 | #283 | Tragic 12.7% |
| Immigrants | Nonimmigrants | 0.1 /100 | #284 | Tragic 12.8% |
| French | 0.1 /100 | #285 | Tragic 12.8% |
| Spanish | 0.1 /100 | #286 | Tragic 12.8% |
| Hondurans | 0.1 /100 | #287 | Tragic 12.8% |
| French Canadians | 0.1 /100 | #288 | Tragic 12.8% |
| Iroquois | 0.0 /100 | #289 | Tragic 12.9% |
| Pima | 0.0 /100 | #290 | Tragic 12.9% |
| Immigrants | Honduras | 0.0 /100 | #291 | Tragic 12.9% |
| Scotch-Irish | 0.0 /100 | #292 | Tragic 12.9% |
Demographics Similar to Immigrants from Italy by Divorced or Separated
In terms of divorced or separated, the demographic groups most similar to Immigrants from Italy are Afghan (11.5%, a difference of 0.10%), Albanian (11.5%, a difference of 0.11%), Immigrants from Northern Africa (11.5%, a difference of 0.13%), Guyanese (11.5%, a difference of 0.14%), and Immigrants from Switzerland (11.5%, a difference of 0.16%).
| Demographics | Rating | Rank | Divorced or Separated |
| Immigrants | Eastern Europe | 99.7 /100 | #70 | Exceptional 11.5% |
| Paraguayans | 99.7 /100 | #71 | Exceptional 11.5% |
| Jordanians | 99.6 /100 | #72 | Exceptional 11.5% |
| Immigrants | North Macedonia | 99.6 /100 | #73 | Exceptional 11.5% |
| Taiwanese | 99.6 /100 | #74 | Exceptional 11.5% |
| Immigrants | Northern Africa | 99.6 /100 | #75 | Exceptional 11.5% |
| Albanians | 99.6 /100 | #76 | Exceptional 11.5% |
| Immigrants | Italy | 99.5 /100 | #77 | Exceptional 11.5% |
| Afghans | 99.4 /100 | #78 | Exceptional 11.5% |
| Guyanese | 99.4 /100 | #79 | Exceptional 11.5% |
| Immigrants | Switzerland | 99.4 /100 | #80 | Exceptional 11.5% |
| Russians | 99.4 /100 | #81 | Exceptional 11.5% |
| Immigrants | Romania | 99.3 /100 | #82 | Exceptional 11.5% |
| Immigrants | Bulgaria | 99.3 /100 | #83 | Exceptional 11.5% |
| Bulgarians | 99.3 /100 | #84 | Exceptional 11.5% |