French vs Immigrants from Hungary Divorced or Separated
COMPARE
French
Immigrants from Hungary
Divorced or Separated
Divorced or Separated Comparison
French
Immigrants from Hungary
12.8%
DIVORCED OR SEPARATED
0.1/ 100
METRIC RATING
285th/ 347
METRIC RANK
11.9%
DIVORCED OR SEPARATED
73.7/ 100
METRIC RATING
152nd/ 347
METRIC RANK
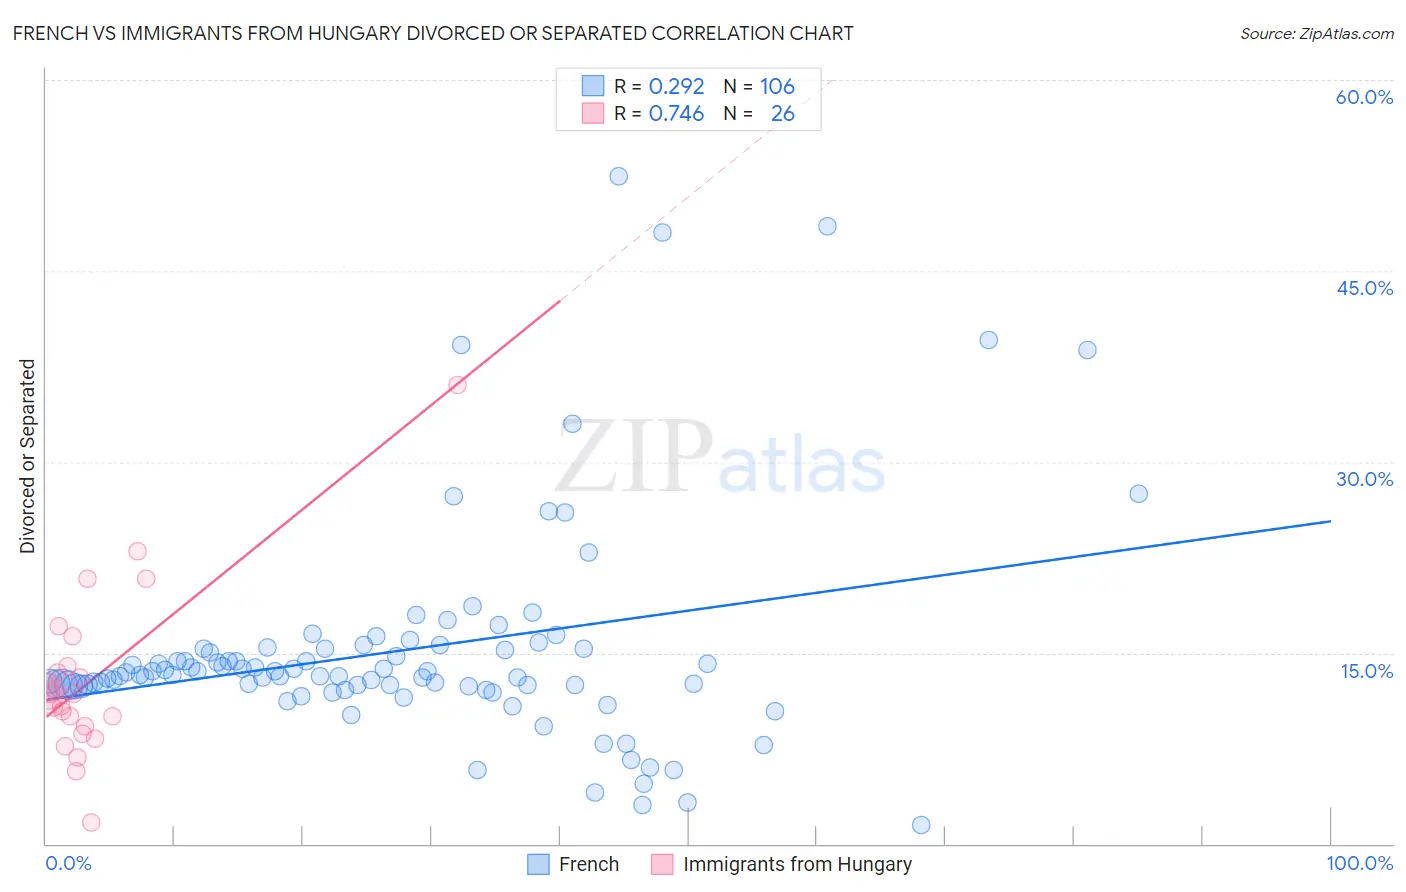
French vs Immigrants from Hungary Divorced or Separated Correlation Chart
The statistical analysis conducted on geographies consisting of 571,939,764 people shows a weak positive correlation between the proportion of French and percentage of population currently divorced or separated in the United States with a correlation coefficient (R) of 0.292 and weighted average of 12.8%. Similarly, the statistical analysis conducted on geographies consisting of 195,671,532 people shows a strong positive correlation between the proportion of Immigrants from Hungary and percentage of population currently divorced or separated in the United States with a correlation coefficient (R) of 0.746 and weighted average of 11.9%, a difference of 6.8%.
Divorced or Separated Correlation Summary
| Measurement | French | Immigrants from Hungary |
| Minimum | 1.5% | 1.7% |
| Maximum | 52.4% | 36.0% |
| Range | 50.9% | 34.3% |
| Mean | 15.2% | 12.8% |
| Median | 13.3% | 11.8% |
| Interquartile 25% (IQ1) | 12.4% | 9.2% |
| Interquartile 75% (IQ3) | 15.3% | 13.9% |
| Interquartile Range (IQR) | 2.9% | 4.7% |
| Standard Deviation (Sample) | 8.7% | 6.7% |
| Standard Deviation (Population) | 8.6% | 6.6% |
Similar Demographics by Divorced or Separated
Demographics Similar to French by Divorced or Separated
In terms of divorced or separated, the demographic groups most similar to French are Nonimmigrants (12.8%, a difference of 0.040%), Delaware (12.7%, a difference of 0.13%), Subsaharan African (12.7%, a difference of 0.14%), Spanish (12.8%, a difference of 0.23%), and Pueblo (12.7%, a difference of 0.26%).
| Demographics | Rating | Rank | Divorced or Separated |
| Lumbee | 0.2 /100 | #278 | Tragic 12.7% |
| Immigrants | Dominican Republic | 0.2 /100 | #279 | Tragic 12.7% |
| Immigrants | Zaire | 0.2 /100 | #280 | Tragic 12.7% |
| Pueblo | 0.2 /100 | #281 | Tragic 12.7% |
| Sub-Saharan Africans | 0.1 /100 | #282 | Tragic 12.7% |
| Delaware | 0.1 /100 | #283 | Tragic 12.7% |
| Immigrants | Nonimmigrants | 0.1 /100 | #284 | Tragic 12.8% |
| French | 0.1 /100 | #285 | Tragic 12.8% |
| Spanish | 0.1 /100 | #286 | Tragic 12.8% |
| Hondurans | 0.1 /100 | #287 | Tragic 12.8% |
| French Canadians | 0.1 /100 | #288 | Tragic 12.8% |
| Iroquois | 0.0 /100 | #289 | Tragic 12.9% |
| Pima | 0.0 /100 | #290 | Tragic 12.9% |
| Immigrants | Honduras | 0.0 /100 | #291 | Tragic 12.9% |
| Scotch-Irish | 0.0 /100 | #292 | Tragic 12.9% |
Demographics Similar to Immigrants from Hungary by Divorced or Separated
In terms of divorced or separated, the demographic groups most similar to Immigrants from Hungary are Austrian (12.0%, a difference of 0.070%), Chilean (12.0%, a difference of 0.10%), Japanese (12.0%, a difference of 0.12%), Czech (11.9%, a difference of 0.13%), and Hungarian (12.0%, a difference of 0.15%).
| Demographics | Rating | Rank | Divorced or Separated |
| Croatians | 80.6 /100 | #145 | Excellent 11.9% |
| Immigrants | Grenada | 79.1 /100 | #146 | Good 11.9% |
| Poles | 78.6 /100 | #147 | Good 11.9% |
| Italians | 77.8 /100 | #148 | Good 11.9% |
| Immigrants | Oceania | 77.7 /100 | #149 | Good 11.9% |
| Immigrants | Portugal | 77.3 /100 | #150 | Good 11.9% |
| Czechs | 76.4 /100 | #151 | Good 11.9% |
| Immigrants | Hungary | 73.7 /100 | #152 | Good 11.9% |
| Austrians | 72.2 /100 | #153 | Good 12.0% |
| Chileans | 71.3 /100 | #154 | Good 12.0% |
| Japanese | 70.9 /100 | #155 | Good 12.0% |
| Hungarians | 70.3 /100 | #156 | Good 12.0% |
| Immigrants | Brazil | 68.8 /100 | #157 | Good 12.0% |
| Icelanders | 66.0 /100 | #158 | Good 12.0% |
| Immigrants | Barbados | 66.0 /100 | #159 | Good 12.0% |