French vs Immigrants from Africa College, 1 year or more
COMPARE
French
Immigrants from Africa
College, 1 year or more
College, 1 year or more Comparison
French
Immigrants from Africa
58.9%
COLLEGE, 1 YEAR OR MORE
34.4/ 100
METRIC RATING
188th/ 347
METRIC RANK
59.6%
COLLEGE, 1 YEAR OR MORE
56.1/ 100
METRIC RATING
166th/ 347
METRIC RANK
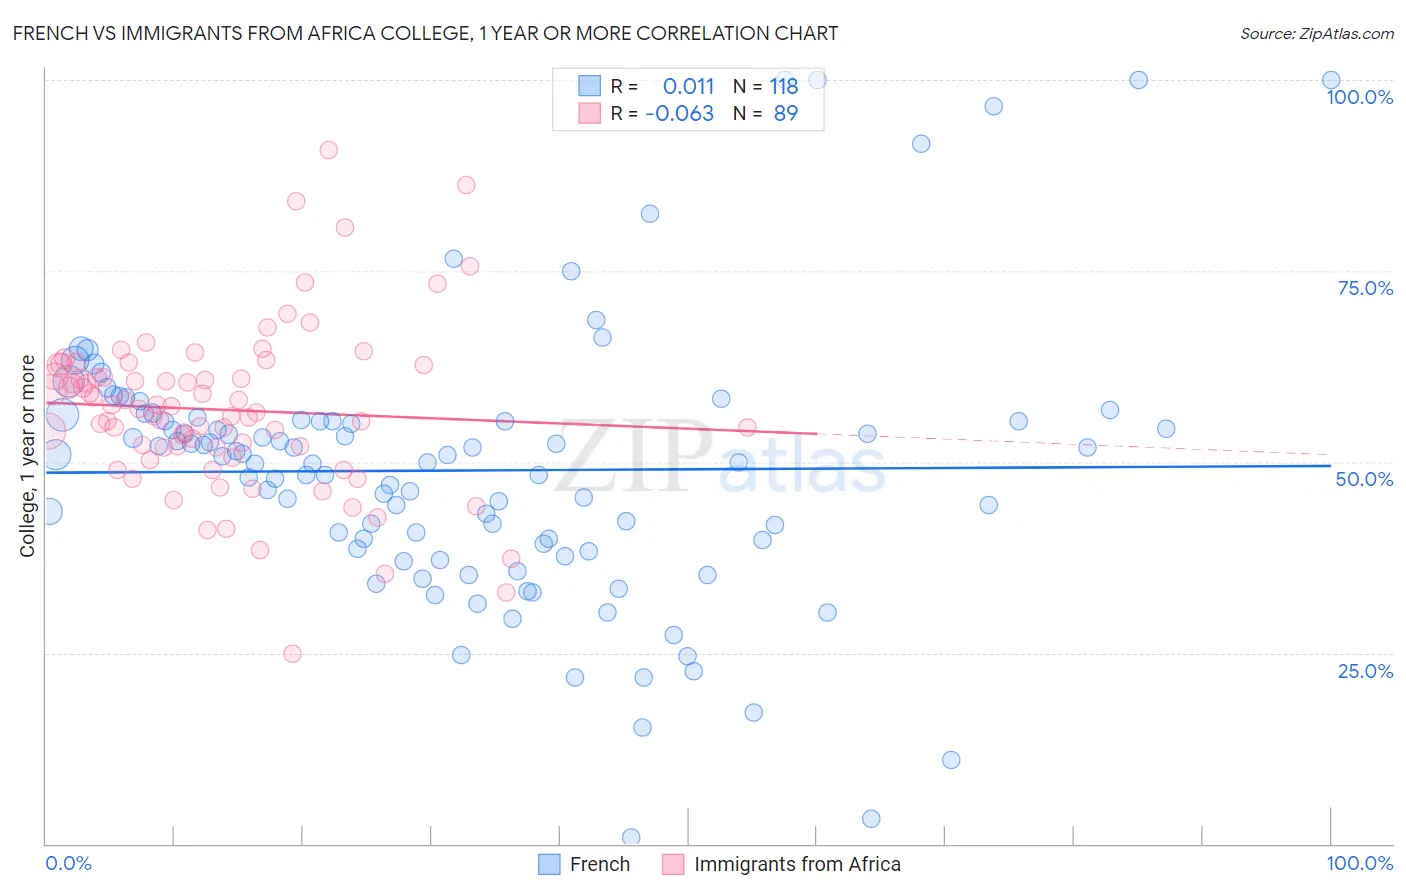
French vs Immigrants from Africa College, 1 year or more Correlation Chart
The statistical analysis conducted on geographies consisting of 572,417,926 people shows no correlation between the proportion of French and percentage of population with at least college, 1 year or more education in the United States with a correlation coefficient (R) of 0.011 and weighted average of 58.9%. Similarly, the statistical analysis conducted on geographies consisting of 469,446,298 people shows a slight negative correlation between the proportion of Immigrants from Africa and percentage of population with at least college, 1 year or more education in the United States with a correlation coefficient (R) of -0.063 and weighted average of 59.6%, a difference of 1.2%.
College, 1 year or more Correlation Summary
| Measurement | French | Immigrants from Africa |
| Minimum | 0.78% | 24.8% |
| Maximum | 100.0% | 90.9% |
| Range | 99.2% | 66.1% |
| Mean | 48.9% | 56.8% |
| Median | 50.4% | 56.9% |
| Interquartile 25% (IQ1) | 39.3% | 51.8% |
| Interquartile 75% (IQ3) | 55.4% | 61.9% |
| Interquartile Range (IQR) | 16.1% | 10.1% |
| Standard Deviation (Sample) | 17.8% | 10.8% |
| Standard Deviation (Population) | 17.7% | 10.8% |
Similar Demographics by College, 1 year or more
Demographics Similar to French by College, 1 year or more
In terms of college, 1 year or more, the demographic groups most similar to French are Scotch-Irish (58.9%, a difference of 0.020%), German (58.9%, a difference of 0.020%), South American (59.0%, a difference of 0.090%), Uruguayan (58.8%, a difference of 0.15%), and Immigrants from Cameroon (58.8%, a difference of 0.19%).
| Demographics | Rating | Rank | College, 1 year or more |
| Swiss | 43.4 /100 | #181 | Average 59.2% |
| Immigrants | Bosnia and Herzegovina | 42.8 /100 | #182 | Average 59.2% |
| German Russians | 39.3 /100 | #183 | Fair 59.1% |
| Spaniards | 38.3 /100 | #184 | Fair 59.0% |
| South Americans | 35.9 /100 | #185 | Fair 59.0% |
| Scotch-Irish | 34.7 /100 | #186 | Fair 58.9% |
| Germans | 34.7 /100 | #187 | Fair 58.9% |
| French | 34.4 /100 | #188 | Fair 58.9% |
| Uruguayans | 31.8 /100 | #189 | Fair 58.8% |
| Immigrants | Cameroon | 31.2 /100 | #190 | Fair 58.8% |
| Immigrants | Philippines | 29.2 /100 | #191 | Fair 58.7% |
| Colombians | 27.6 /100 | #192 | Fair 58.7% |
| Peruvians | 27.5 /100 | #193 | Fair 58.6% |
| Costa Ricans | 26.4 /100 | #194 | Fair 58.6% |
| Dutch | 26.2 /100 | #195 | Fair 58.6% |
Demographics Similar to Immigrants from Africa by College, 1 year or more
In terms of college, 1 year or more, the demographic groups most similar to Immigrants from Africa are Irish (59.6%, a difference of 0.0%), Belgian (59.7%, a difference of 0.11%), Immigrants from Somalia (59.7%, a difference of 0.12%), Korean (59.7%, a difference of 0.13%), and Immigrants from North Macedonia (59.5%, a difference of 0.16%).
| Demographics | Rating | Rank | College, 1 year or more |
| Immigrants | Iraq | 67.0 /100 | #159 | Good 60.0% |
| South American Indians | 66.9 /100 | #160 | Good 60.0% |
| Somalis | 64.5 /100 | #161 | Good 59.9% |
| Koreans | 58.5 /100 | #162 | Average 59.7% |
| Immigrants | Somalia | 58.3 /100 | #163 | Average 59.7% |
| Belgians | 58.1 /100 | #164 | Average 59.7% |
| Irish | 56.1 /100 | #165 | Average 59.6% |
| Immigrants | Africa | 56.1 /100 | #166 | Average 59.6% |
| Immigrants | North Macedonia | 53.1 /100 | #167 | Average 59.5% |
| Hungarians | 52.9 /100 | #168 | Average 59.5% |
| Immigrants | Southern Europe | 52.7 /100 | #169 | Average 59.5% |
| Welsh | 52.4 /100 | #170 | Average 59.5% |
| Immigrants | Albania | 52.3 /100 | #171 | Average 59.5% |
| Immigrants | Sierra Leone | 52.2 /100 | #172 | Average 59.5% |
| Immigrants | Oceania | 51.2 /100 | #173 | Average 59.4% |