French vs Immigrants from Russia Divorced or Separated
COMPARE
French
Immigrants from Russia
Divorced or Separated
Divorced or Separated Comparison
French
Immigrants from Russia
12.8%
DIVORCED OR SEPARATED
0.1/ 100
METRIC RATING
285th/ 347
METRIC RANK
11.3%
DIVORCED OR SEPARATED
99.9/ 100
METRIC RATING
60th/ 347
METRIC RANK
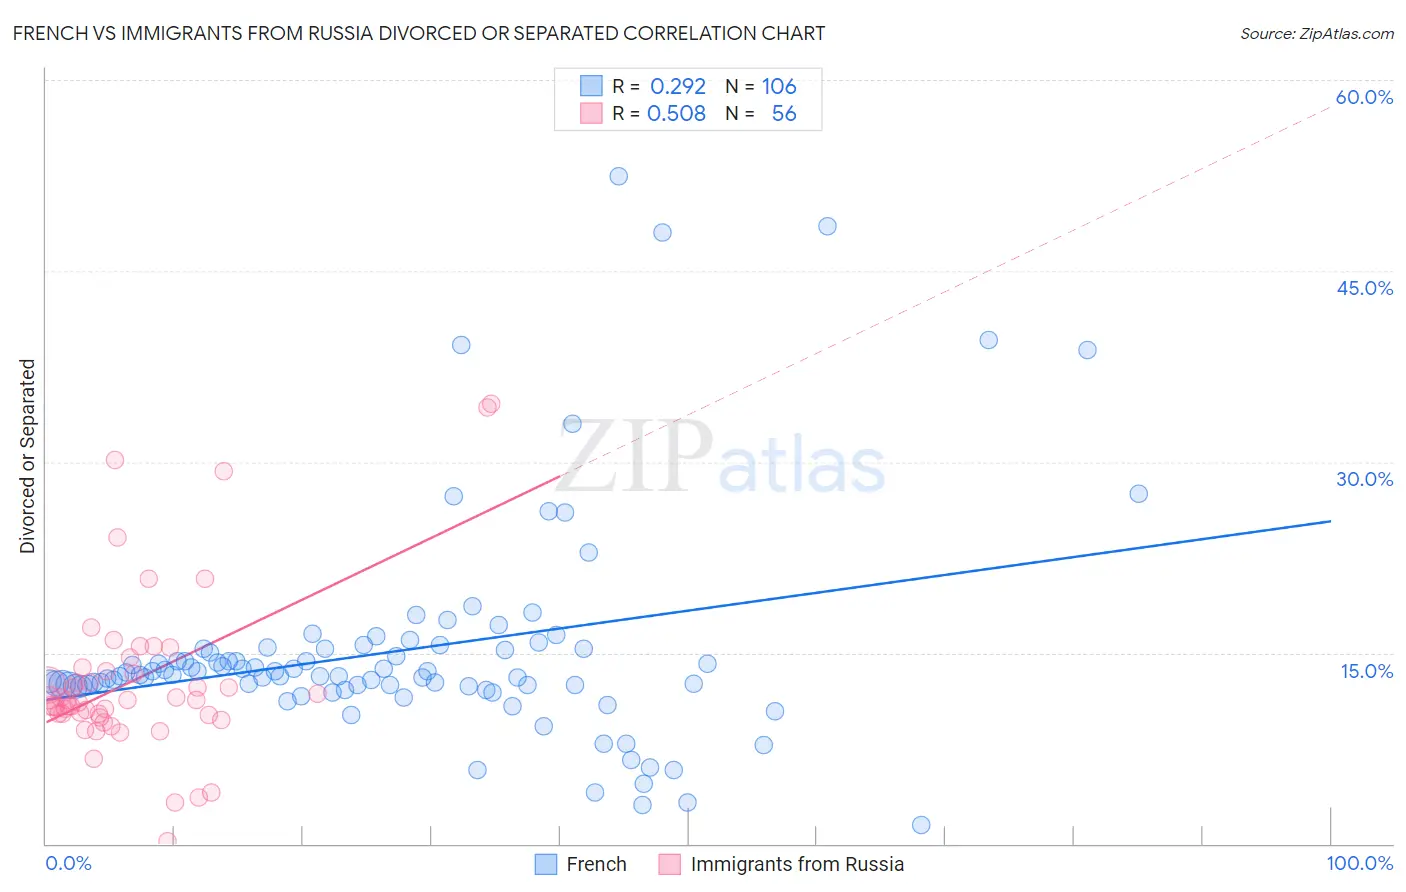
French vs Immigrants from Russia Divorced or Separated Correlation Chart
The statistical analysis conducted on geographies consisting of 571,939,764 people shows a weak positive correlation between the proportion of French and percentage of population currently divorced or separated in the United States with a correlation coefficient (R) of 0.292 and weighted average of 12.8%. Similarly, the statistical analysis conducted on geographies consisting of 347,782,642 people shows a substantial positive correlation between the proportion of Immigrants from Russia and percentage of population currently divorced or separated in the United States with a correlation coefficient (R) of 0.508 and weighted average of 11.3%, a difference of 12.4%.
Divorced or Separated Correlation Summary
| Measurement | French | Immigrants from Russia |
| Minimum | 1.5% | 0.20% |
| Maximum | 52.4% | 34.6% |
| Range | 50.9% | 34.4% |
| Mean | 15.2% | 12.9% |
| Median | 13.3% | 11.3% |
| Interquartile 25% (IQ1) | 12.4% | 10.1% |
| Interquartile 75% (IQ3) | 15.3% | 13.7% |
| Interquartile Range (IQR) | 2.9% | 3.5% |
| Standard Deviation (Sample) | 8.7% | 6.7% |
| Standard Deviation (Population) | 8.6% | 6.6% |
Similar Demographics by Divorced or Separated
Demographics Similar to French by Divorced or Separated
In terms of divorced or separated, the demographic groups most similar to French are Nonimmigrants (12.8%, a difference of 0.040%), Delaware (12.7%, a difference of 0.13%), Subsaharan African (12.7%, a difference of 0.14%), Spanish (12.8%, a difference of 0.23%), and Pueblo (12.7%, a difference of 0.26%).
| Demographics | Rating | Rank | Divorced or Separated |
| Lumbee | 0.2 /100 | #278 | Tragic 12.7% |
| Immigrants | Dominican Republic | 0.2 /100 | #279 | Tragic 12.7% |
| Immigrants | Zaire | 0.2 /100 | #280 | Tragic 12.7% |
| Pueblo | 0.2 /100 | #281 | Tragic 12.7% |
| Sub-Saharan Africans | 0.1 /100 | #282 | Tragic 12.7% |
| Delaware | 0.1 /100 | #283 | Tragic 12.7% |
| Immigrants | Nonimmigrants | 0.1 /100 | #284 | Tragic 12.8% |
| French | 0.1 /100 | #285 | Tragic 12.8% |
| Spanish | 0.1 /100 | #286 | Tragic 12.8% |
| Hondurans | 0.1 /100 | #287 | Tragic 12.8% |
| French Canadians | 0.1 /100 | #288 | Tragic 12.8% |
| Iroquois | 0.0 /100 | #289 | Tragic 12.9% |
| Pima | 0.0 /100 | #290 | Tragic 12.9% |
| Immigrants | Honduras | 0.0 /100 | #291 | Tragic 12.9% |
| Scotch-Irish | 0.0 /100 | #292 | Tragic 12.9% |
Demographics Similar to Immigrants from Russia by Divorced or Separated
In terms of divorced or separated, the demographic groups most similar to Immigrants from Russia are Korean (11.3%, a difference of 0.010%), Luxembourger (11.3%, a difference of 0.010%), Immigrants from Kuwait (11.3%, a difference of 0.020%), Israeli (11.3%, a difference of 0.16%), and Sri Lankan (11.3%, a difference of 0.26%).
| Demographics | Rating | Rank | Divorced or Separated |
| Immigrants | Lithuania | 99.9 /100 | #53 | Exceptional 11.3% |
| Eastern Europeans | 99.9 /100 | #54 | Exceptional 11.3% |
| Immigrants | Yemen | 99.9 /100 | #55 | Exceptional 11.3% |
| Immigrants | Philippines | 99.9 /100 | #56 | Exceptional 11.3% |
| Immigrants | Vietnam | 99.9 /100 | #57 | Exceptional 11.3% |
| Sri Lankans | 99.9 /100 | #58 | Exceptional 11.3% |
| Israelis | 99.9 /100 | #59 | Exceptional 11.3% |
| Immigrants | Russia | 99.9 /100 | #60 | Exceptional 11.3% |
| Koreans | 99.9 /100 | #61 | Exceptional 11.3% |
| Luxembourgers | 99.9 /100 | #62 | Exceptional 11.3% |
| Immigrants | Kuwait | 99.9 /100 | #63 | Exceptional 11.3% |
| Macedonians | 99.8 /100 | #64 | Exceptional 11.4% |
| Immigrants | South Eastern Asia | 99.8 /100 | #65 | Exceptional 11.4% |
| Inupiat | 99.8 /100 | #66 | Exceptional 11.4% |
| Immigrants | Syria | 99.7 /100 | #67 | Exceptional 11.4% |