French vs Salvadoran Divorced or Separated
COMPARE
French
Salvadoran
Divorced or Separated
Divorced or Separated Comparison
French
Salvadorans
12.8%
DIVORCED OR SEPARATED
0.1/ 100
METRIC RATING
285th/ 347
METRIC RANK
11.6%
DIVORCED OR SEPARATED
98.2/ 100
METRIC RATING
104th/ 347
METRIC RANK
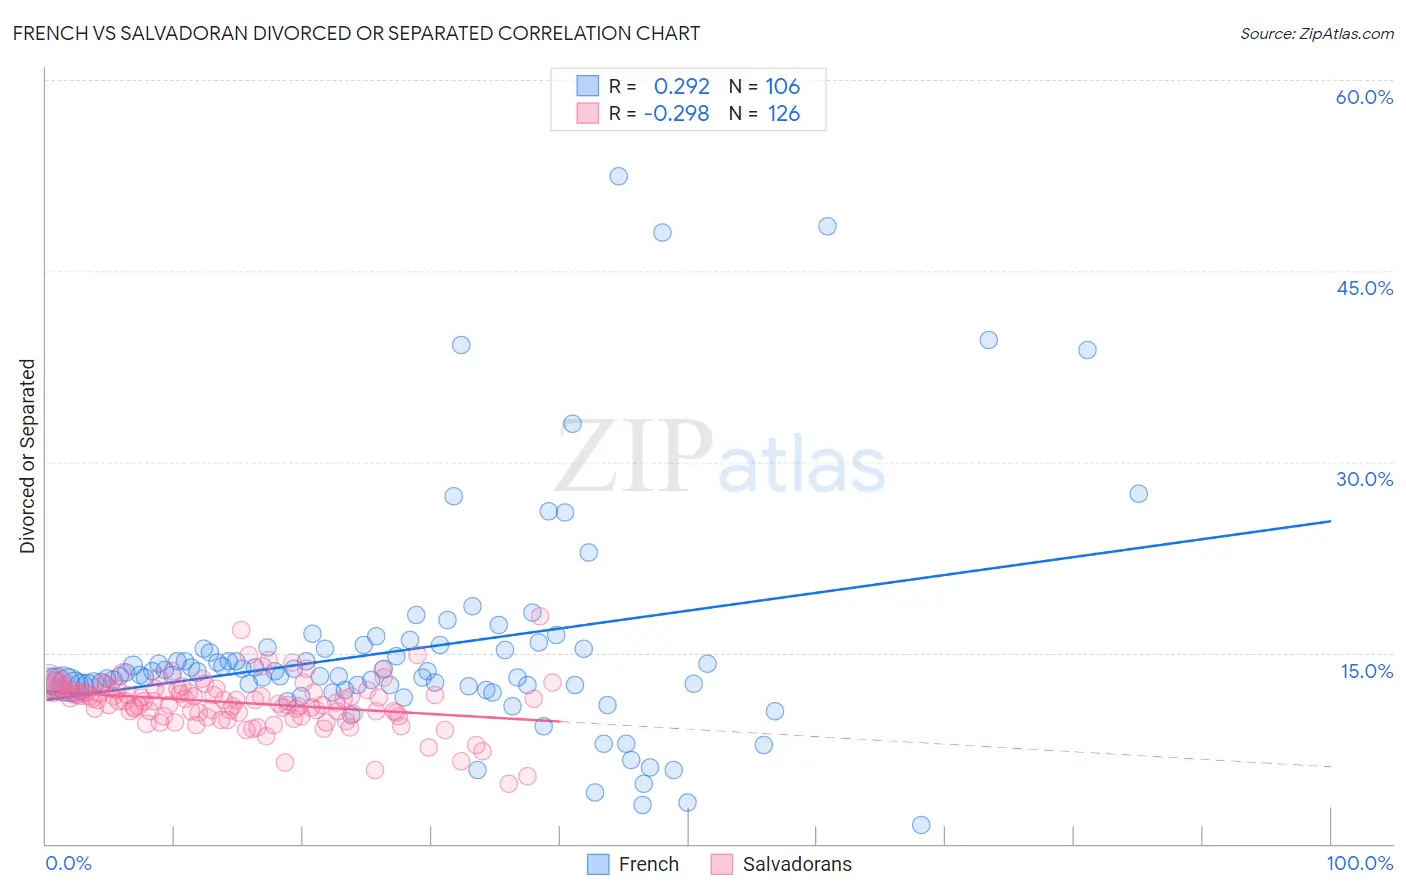
French vs Salvadoran Divorced or Separated Correlation Chart
The statistical analysis conducted on geographies consisting of 571,939,764 people shows a weak positive correlation between the proportion of French and percentage of population currently divorced or separated in the United States with a correlation coefficient (R) of 0.292 and weighted average of 12.8%. Similarly, the statistical analysis conducted on geographies consisting of 398,863,882 people shows a weak negative correlation between the proportion of Salvadorans and percentage of population currently divorced or separated in the United States with a correlation coefficient (R) of -0.298 and weighted average of 11.6%, a difference of 9.6%.
Divorced or Separated Correlation Summary
| Measurement | French | Salvadoran |
| Minimum | 1.5% | 4.7% |
| Maximum | 52.4% | 17.9% |
| Range | 50.9% | 13.2% |
| Mean | 15.2% | 11.1% |
| Median | 13.3% | 11.3% |
| Interquartile 25% (IQ1) | 12.4% | 10.3% |
| Interquartile 75% (IQ3) | 15.3% | 12.1% |
| Interquartile Range (IQR) | 2.9% | 1.8% |
| Standard Deviation (Sample) | 8.7% | 1.9% |
| Standard Deviation (Population) | 8.6% | 1.9% |
Similar Demographics by Divorced or Separated
Demographics Similar to French by Divorced or Separated
In terms of divorced or separated, the demographic groups most similar to French are Nonimmigrants (12.8%, a difference of 0.040%), Delaware (12.7%, a difference of 0.13%), Subsaharan African (12.7%, a difference of 0.14%), Spanish (12.8%, a difference of 0.23%), and Pueblo (12.7%, a difference of 0.26%).
| Demographics | Rating | Rank | Divorced or Separated |
| Lumbee | 0.2 /100 | #278 | Tragic 12.7% |
| Immigrants | Dominican Republic | 0.2 /100 | #279 | Tragic 12.7% |
| Immigrants | Zaire | 0.2 /100 | #280 | Tragic 12.7% |
| Pueblo | 0.2 /100 | #281 | Tragic 12.7% |
| Sub-Saharan Africans | 0.1 /100 | #282 | Tragic 12.7% |
| Delaware | 0.1 /100 | #283 | Tragic 12.7% |
| Immigrants | Nonimmigrants | 0.1 /100 | #284 | Tragic 12.8% |
| French | 0.1 /100 | #285 | Tragic 12.8% |
| Spanish | 0.1 /100 | #286 | Tragic 12.8% |
| Hondurans | 0.1 /100 | #287 | Tragic 12.8% |
| French Canadians | 0.1 /100 | #288 | Tragic 12.8% |
| Iroquois | 0.0 /100 | #289 | Tragic 12.9% |
| Pima | 0.0 /100 | #290 | Tragic 12.9% |
| Immigrants | Honduras | 0.0 /100 | #291 | Tragic 12.9% |
| Scotch-Irish | 0.0 /100 | #292 | Tragic 12.9% |
Demographics Similar to Salvadorans by Divorced or Separated
In terms of divorced or separated, the demographic groups most similar to Salvadorans are Maltese (11.6%, a difference of 0.020%), Immigrants from Croatia (11.6%, a difference of 0.050%), Immigrants from El Salvador (11.7%, a difference of 0.12%), Immigrants from Kazakhstan (11.7%, a difference of 0.16%), and Immigrants from Guyana (11.6%, a difference of 0.19%).
| Demographics | Rating | Rank | Divorced or Separated |
| Latvians | 98.7 /100 | #97 | Exceptional 11.6% |
| Immigrants | Jordan | 98.6 /100 | #98 | Exceptional 11.6% |
| Immigrants | Sweden | 98.6 /100 | #99 | Exceptional 11.6% |
| Immigrants | Northern Europe | 98.6 /100 | #100 | Exceptional 11.6% |
| Immigrants | Guyana | 98.5 /100 | #101 | Exceptional 11.6% |
| Immigrants | Croatia | 98.3 /100 | #102 | Exceptional 11.6% |
| Maltese | 98.2 /100 | #103 | Exceptional 11.6% |
| Salvadorans | 98.2 /100 | #104 | Exceptional 11.6% |
| Immigrants | El Salvador | 97.9 /100 | #105 | Exceptional 11.7% |
| Immigrants | Kazakhstan | 97.8 /100 | #106 | Exceptional 11.7% |
| Native Hawaiians | 97.2 /100 | #107 | Exceptional 11.7% |
| Greeks | 96.9 /100 | #108 | Exceptional 11.7% |
| Immigrants | South Africa | 96.9 /100 | #109 | Exceptional 11.7% |
| Immigrants | Czechoslovakia | 96.9 /100 | #110 | Exceptional 11.7% |
| Immigrants | Spain | 96.8 /100 | #111 | Exceptional 11.7% |