French vs English Divorced or Separated
COMPARE
French
English
Divorced or Separated
Divorced or Separated Comparison
French
English
12.8%
DIVORCED OR SEPARATED
0.1/ 100
METRIC RATING
285th/ 347
METRIC RANK
12.6%
DIVORCED OR SEPARATED
0.5/ 100
METRIC RATING
264th/ 347
METRIC RANK
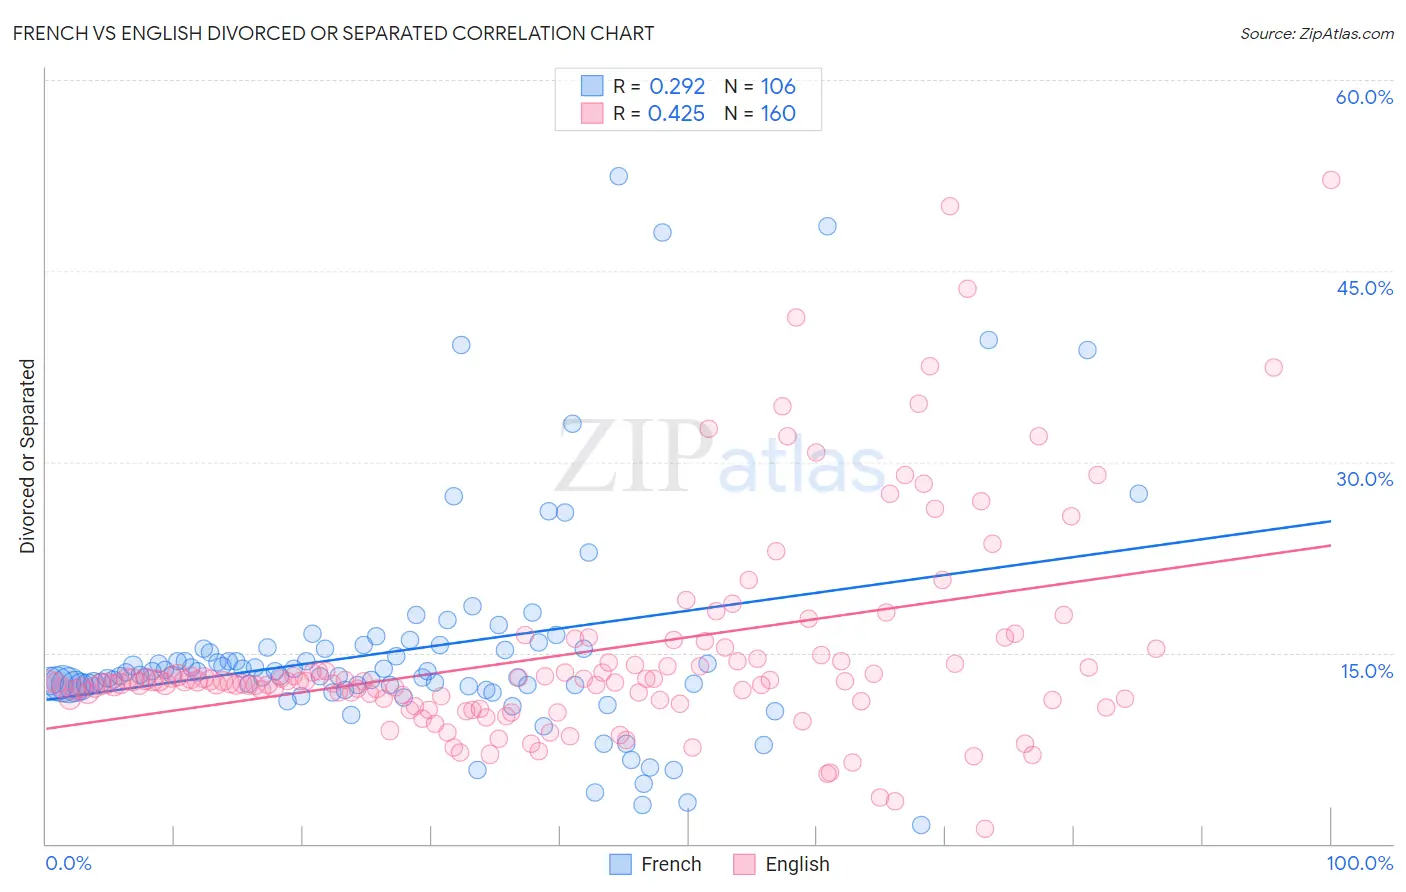
French vs English Divorced or Separated Correlation Chart
The statistical analysis conducted on geographies consisting of 571,939,764 people shows a weak positive correlation between the proportion of French and percentage of population currently divorced or separated in the United States with a correlation coefficient (R) of 0.292 and weighted average of 12.8%. Similarly, the statistical analysis conducted on geographies consisting of 579,335,226 people shows a moderate positive correlation between the proportion of English and percentage of population currently divorced or separated in the United States with a correlation coefficient (R) of 0.425 and weighted average of 12.6%, a difference of 1.1%.
Divorced or Separated Correlation Summary
| Measurement | French | English |
| Minimum | 1.5% | 1.2% |
| Maximum | 52.4% | 52.1% |
| Range | 50.9% | 50.9% |
| Mean | 15.2% | 14.9% |
| Median | 13.3% | 12.8% |
| Interquartile 25% (IQ1) | 12.4% | 11.3% |
| Interquartile 75% (IQ3) | 15.3% | 14.4% |
| Interquartile Range (IQR) | 2.9% | 3.1% |
| Standard Deviation (Sample) | 8.7% | 8.2% |
| Standard Deviation (Population) | 8.6% | 8.2% |
Similar Demographics by Divorced or Separated
Demographics Similar to French by Divorced or Separated
In terms of divorced or separated, the demographic groups most similar to French are Nonimmigrants (12.8%, a difference of 0.040%), Delaware (12.7%, a difference of 0.13%), Subsaharan African (12.7%, a difference of 0.14%), Spanish (12.8%, a difference of 0.23%), and Pueblo (12.7%, a difference of 0.26%).
| Demographics | Rating | Rank | Divorced or Separated |
| Lumbee | 0.2 /100 | #278 | Tragic 12.7% |
| Immigrants | Dominican Republic | 0.2 /100 | #279 | Tragic 12.7% |
| Immigrants | Zaire | 0.2 /100 | #280 | Tragic 12.7% |
| Pueblo | 0.2 /100 | #281 | Tragic 12.7% |
| Sub-Saharan Africans | 0.1 /100 | #282 | Tragic 12.7% |
| Delaware | 0.1 /100 | #283 | Tragic 12.7% |
| Immigrants | Nonimmigrants | 0.1 /100 | #284 | Tragic 12.8% |
| French | 0.1 /100 | #285 | Tragic 12.8% |
| Spanish | 0.1 /100 | #286 | Tragic 12.8% |
| Hondurans | 0.1 /100 | #287 | Tragic 12.8% |
| French Canadians | 0.1 /100 | #288 | Tragic 12.8% |
| Iroquois | 0.0 /100 | #289 | Tragic 12.9% |
| Pima | 0.0 /100 | #290 | Tragic 12.9% |
| Immigrants | Honduras | 0.0 /100 | #291 | Tragic 12.9% |
| Scotch-Irish | 0.0 /100 | #292 | Tragic 12.9% |
Demographics Similar to English by Divorced or Separated
In terms of divorced or separated, the demographic groups most similar to English are Immigrants from Panama (12.6%, a difference of 0.020%), Immigrants from Senegal (12.6%, a difference of 0.020%), White/Caucasian (12.6%, a difference of 0.030%), Basque (12.6%, a difference of 0.070%), and Scottish (12.6%, a difference of 0.070%).
| Demographics | Rating | Rank | Divorced or Separated |
| Immigrants | Somalia | 0.6 /100 | #257 | Tragic 12.6% |
| Indonesians | 0.6 /100 | #258 | Tragic 12.6% |
| Yuman | 0.6 /100 | #259 | Tragic 12.6% |
| Immigrants | Uruguay | 0.6 /100 | #260 | Tragic 12.6% |
| Immigrants | Dominica | 0.5 /100 | #261 | Tragic 12.6% |
| Basques | 0.5 /100 | #262 | Tragic 12.6% |
| Immigrants | Panama | 0.5 /100 | #263 | Tragic 12.6% |
| English | 0.5 /100 | #264 | Tragic 12.6% |
| Immigrants | Senegal | 0.5 /100 | #265 | Tragic 12.6% |
| Whites/Caucasians | 0.5 /100 | #266 | Tragic 12.6% |
| Scottish | 0.4 /100 | #267 | Tragic 12.6% |
| Fijians | 0.4 /100 | #268 | Tragic 12.6% |
| Immigrants | Liberia | 0.4 /100 | #269 | Tragic 12.6% |
| Ute | 0.4 /100 | #270 | Tragic 12.6% |
| Panamanians | 0.3 /100 | #271 | Tragic 12.7% |