Finnish vs Immigrants from Philippines Average Family Size
COMPARE
Finnish
Immigrants from Philippines
Average Family Size
Average Family Size Comparison
Finns
Immigrants from Philippines
3.09
AVERAGE FAMILY SIZE
0.0/ 100
METRIC RATING
340th/ 347
METRIC RANK
3.37
AVERAGE FAMILY SIZE
100.0/ 100
METRIC RATING
43rd/ 347
METRIC RANK
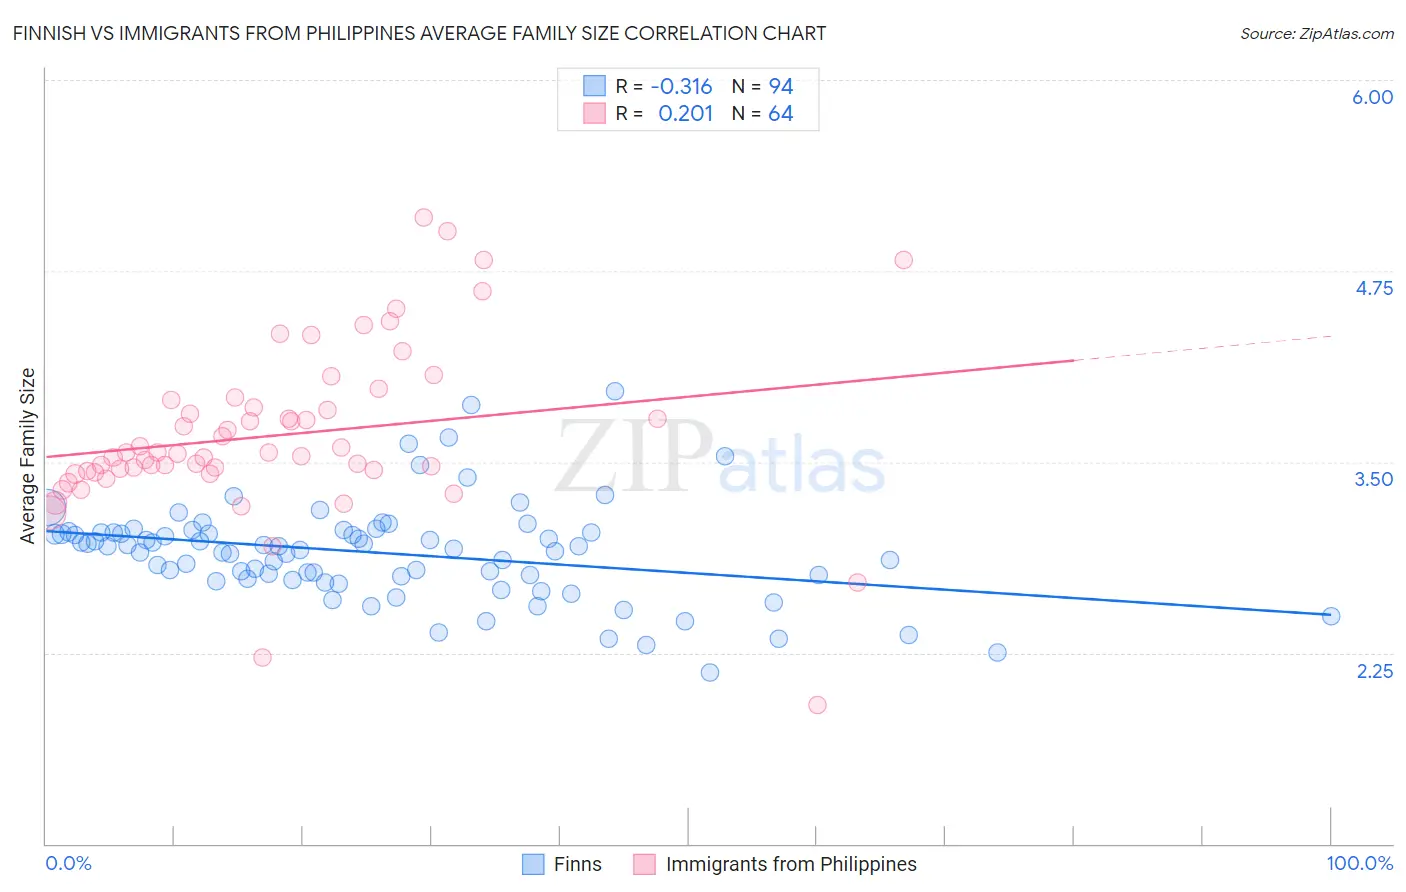
Finnish vs Immigrants from Philippines Average Family Size Correlation Chart
The statistical analysis conducted on geographies consisting of 404,508,275 people shows a mild negative correlation between the proportion of Finns and average family size in the United States with a correlation coefficient (R) of -0.316 and weighted average of 3.09. Similarly, the statistical analysis conducted on geographies consisting of 471,024,108 people shows a weak positive correlation between the proportion of Immigrants from Philippines and average family size in the United States with a correlation coefficient (R) of 0.201 and weighted average of 3.37, a difference of 9.1%.
Average Family Size Correlation Summary
| Measurement | Finnish | Immigrants from Philippines |
| Minimum | 2.12 | 1.91 |
| Maximum | 3.96 | 5.10 |
| Range | 1.84 | 3.19 |
| Mean | 2.90 | 3.68 |
| Median | 2.94 | 3.56 |
| Interquartile 25% (IQ1) | 2.74 | 3.44 |
| Interquartile 75% (IQ3) | 3.04 | 3.88 |
| Interquartile Range (IQR) | 0.30 | 0.44 |
| Standard Deviation (Sample) | 0.32 | 0.56 |
| Standard Deviation (Population) | 0.32 | 0.56 |
Similar Demographics by Average Family Size
Demographics Similar to Finns by Average Family Size
In terms of average family size, the demographic groups most similar to Finns are Polish (3.09, a difference of 0.050%), Croatian (3.10, a difference of 0.14%), French (3.10, a difference of 0.16%), Swedish (3.10, a difference of 0.18%), and German (3.09, a difference of 0.19%).
| Demographics | Rating | Rank | Average Family Size |
| Estonians | 0.0 /100 | #333 | Tragic 3.10 |
| Lithuanians | 0.0 /100 | #334 | Tragic 3.10 |
| Luxembourgers | 0.0 /100 | #335 | Tragic 3.10 |
| Irish | 0.0 /100 | #336 | Tragic 3.10 |
| Swedes | 0.0 /100 | #337 | Tragic 3.10 |
| French | 0.0 /100 | #338 | Tragic 3.10 |
| Croatians | 0.0 /100 | #339 | Tragic 3.10 |
| Finns | 0.0 /100 | #340 | Tragic 3.09 |
| Poles | 0.0 /100 | #341 | Tragic 3.09 |
| Germans | 0.0 /100 | #342 | Tragic 3.09 |
| Norwegians | 0.0 /100 | #343 | Tragic 3.08 |
| French Canadians | 0.0 /100 | #344 | Tragic 3.07 |
| Slovenes | 0.0 /100 | #345 | Tragic 3.07 |
| Slovaks | 0.0 /100 | #346 | Tragic 3.06 |
| Carpatho Rusyns | 0.0 /100 | #347 | Tragic 3.06 |
Demographics Similar to Immigrants from Philippines by Average Family Size
In terms of average family size, the demographic groups most similar to Immigrants from Philippines are Alaska Native (3.37, a difference of 0.010%), Shoshone (3.37, a difference of 0.040%), Immigrants from Vietnam (3.38, a difference of 0.10%), Haitian (3.37, a difference of 0.10%), and Vietnamese (3.37, a difference of 0.14%).
| Demographics | Rating | Rank | Average Family Size |
| Immigrants | Guyana | 100.0 /100 | #36 | Exceptional 3.40 |
| Guyanese | 100.0 /100 | #37 | Exceptional 3.40 |
| Immigrants | Belize | 100.0 /100 | #38 | Exceptional 3.39 |
| Immigrants | Haiti | 100.0 /100 | #39 | Exceptional 3.39 |
| Belizeans | 100.0 /100 | #40 | Exceptional 3.39 |
| Marshallese | 100.0 /100 | #41 | Exceptional 3.38 |
| Immigrants | Vietnam | 100.0 /100 | #42 | Exceptional 3.38 |
| Immigrants | Philippines | 100.0 /100 | #43 | Exceptional 3.37 |
| Alaska Natives | 100.0 /100 | #44 | Exceptional 3.37 |
| Shoshone | 100.0 /100 | #45 | Exceptional 3.37 |
| Haitians | 100.0 /100 | #46 | Exceptional 3.37 |
| Vietnamese | 100.0 /100 | #47 | Exceptional 3.37 |
| Immigrants | Nicaragua | 100.0 /100 | #48 | Exceptional 3.37 |
| Bangladeshis | 100.0 /100 | #49 | Exceptional 3.37 |
| Immigrants | Bangladesh | 100.0 /100 | #50 | Exceptional 3.36 |