Malaysian vs Immigrants from Philippines Average Family Size

COMPARE

Malaysian
Race
Ancestry
AfghanAfricanAlaska NativeAlaskan AthabascanAlbanianAleutAlsatianAmericanApacheArabArapahoArgentineanArmenianAssyrian/Chaldean/SyriacAustralianAustrianBahamianBangladeshiBarbadianBasqueBelgianBelizeanBermudanBhutaneseBlackfeetBolivianBrazilianBritishBritish West IndianBulgarianBurmeseCajunCambodianCanadianCape VerdeanCarpatho RusynCelticCentral AmericanCentral American IndianCherokeeCheyenneChickasawChileanChineseChippewaChoctawColombianColvilleComancheCosta RicanCreeCreekCroatianCrowCubanCypriotCzechCzechoslovakianDanishDelawareDominicanDutchDutch West IndianEastern EuropeanEcuadorianEgyptianEnglishEstonianEthiopianEuropeanFijianFilipinoFinnishFrenchFrench American IndianFrench CanadianGermanGerman RussianGhanaianGreekGuamanian/ChamorroGuatemalanGuyaneseHaitianHmongHonduranHopiHoumaHungarianIcelanderIndian (Asian)IndonesianInupiatIranianIraqiIrishIroquoisIsraeliItalianJamaicanJapaneseJordanianKenyanKiowaKoreanLaotianLatvianLebaneseLiberianLithuanianLumbeeLuxembourgerMacedonianMalaysianMalteseMarshalleseMenomineeMexicanMexican American IndianMongolianMoroccanNative HawaiianNavajoNepaleseNew ZealanderNicaraguanNigerianNorthern EuropeanNorwegianOkinawanOsageOttawaPaiutePakistaniPalestinianPanamanianParaguayanPennsylvania GermanPeruvianPimaPolishPortuguesePotawatomiPuebloPuerto RicanPuget Sound SalishRomanianRussianSalvadoranSamoanScandinavianScotch-IrishScottishSeminoleSenegaleseSerbianShoshoneSierra LeoneanSiouxSlavicSlovakSloveneSomaliSouth AfricanSouth AmericanSouth American IndianSoviet UnionSpaniardSpanishSpanish AmericanSpanish American IndianSri LankanSubsaharan AfricanSudaneseSwedishSwissSyrianTaiwaneseThaiTlingit-HaidaTohono O'OdhamTonganTrinidadian and TobagonianTsimshianTurkishU.S. Virgin IslanderUgandanUkrainianUruguayanUteVenezuelanVietnameseWelshWest IndianYakamaYaquiYugoslavianYumanYup'ikZimbabwean
Immigration
NonimmigrantsImmigrantsAfghanistanAfricaAlbaniaArgentinaArmeniaAsiaAustraliaAustriaBahamasBangladeshBarbadosBelarusBelgiumBelizeBoliviaBosnia and HerzegovinaBrazilBulgariaBurma/MyanmarCabo VerdeCambodiaCameroonCanadaCaribbeanCentral AmericaChileChinaColombiaCongoCosta RicaCroatiaCubaCzechoslovakiaDenmarkDominicaDominican RepublicEastern AfricaEastern AsiaEastern EuropeEcuadorEgyptEl SalvadorEnglandEritreaEthiopiaEuropeFijiFranceGermanyGhanaGreeceGrenadaGuatemalaGuyanaHaitiHondurasHong KongHungaryIndiaIndonesiaIranIraqIrelandIsraelItalyJamaicaJapanJordanKazakhstanKenyaKoreaKuwaitLaosLatin AmericaLatviaLebanonLiberiaLithuaniaMalaysiaMexicoMicronesiaMiddle AfricaMoldovaMoroccoNepalNetherlandsNicaraguaNigeriaNorth AmericaNorth MacedoniaNorthern AfricaNorthern EuropeNorwayOceaniaPakistanPanamaPeruPolandPortugalRomaniaRussiaSaudi ArabiaScotlandSenegalSerbiaSierra LeoneSingaporeSomaliaSouth AfricaSouth AmericaSouth Central AsiaSouth Eastern AsiaSouthern EuropeSpainSri LankaSt. Vincent and the GrenadinesSudanSwedenSwitzerlandSyriaTaiwanThailandTrinidad and TobagoTurkeyUgandaUkraineUruguayUzbekistanVenezuelaVietnamWest IndiesWestern AfricaWestern AsiaWestern EuropeYemenZaireZimbabweAzores
Immigrants from Philippines
Race
Ancestry
AfghanAfricanAlaska NativeAlaskan AthabascanAlbanianAleutAlsatianAmericanApacheArabArapahoArgentineanArmenianAssyrian/Chaldean/SyriacAustralianAustrianBahamianBangladeshiBarbadianBasqueBelgianBelizeanBermudanBhutaneseBlackfeetBolivianBrazilianBritishBritish West IndianBulgarianBurmeseCajunCambodianCanadianCape VerdeanCarpatho RusynCelticCentral AmericanCentral American IndianCherokeeCheyenneChickasawChileanChineseChippewaChoctawColombianColvilleComancheCosta RicanCreeCreekCroatianCrowCubanCypriotCzechCzechoslovakianDanishDelawareDominicanDutchDutch West IndianEastern EuropeanEcuadorianEgyptianEnglishEstonianEthiopianEuropeanFijianFilipinoFinnishFrenchFrench American IndianFrench CanadianGermanGerman RussianGhanaianGreekGuamanian/ChamorroGuatemalanGuyaneseHaitianHmongHonduranHopiHoumaHungarianIcelanderIndian (Asian)IndonesianInupiatIranianIraqiIrishIroquoisIsraeliItalianJamaicanJapaneseJordanianKenyanKiowaKoreanLaotianLatvianLebaneseLiberianLithuanianLumbeeLuxembourgerMacedonianMalteseMarshalleseMenomineeMexicanMexican American IndianMongolianMoroccanNative HawaiianNavajoNepaleseNew ZealanderNicaraguanNigerianNorthern EuropeanNorwegianOkinawanOsageOttawaPaiutePakistaniPalestinianPanamanianParaguayanPennsylvania GermanPeruvianPimaPolishPortuguesePotawatomiPuebloPuerto RicanPuget Sound SalishRomanianRussianSalvadoranSamoanScandinavianScotch-IrishScottishSeminoleSenegaleseSerbianShoshoneSierra LeoneanSiouxSlavicSlovakSloveneSomaliSouth AfricanSouth AmericanSouth American IndianSoviet UnionSpaniardSpanishSpanish AmericanSpanish American IndianSri LankanSubsaharan AfricanSudaneseSwedishSwissSyrianTaiwaneseThaiTlingit-HaidaTohono O'OdhamTonganTrinidadian and TobagonianTsimshianTurkishU.S. Virgin IslanderUgandanUkrainianUruguayanUteVenezuelanVietnameseWelshWest IndianYakamaYaquiYugoslavianYumanYup'ikZimbabwean
Immigration
NonimmigrantsImmigrantsAfghanistanAfricaAlbaniaArgentinaArmeniaAsiaAustraliaAustriaBahamasBangladeshBarbadosBelarusBelgiumBelizeBoliviaBosnia and HerzegovinaBrazilBulgariaBurma/MyanmarCabo VerdeCambodiaCameroonCanadaCaribbeanCentral AmericaChileChinaColombiaCongoCosta RicaCroatiaCubaCzechoslovakiaDenmarkDominicaDominican RepublicEastern AfricaEastern AsiaEastern EuropeEcuadorEgyptEl SalvadorEnglandEritreaEthiopiaEuropeFijiFranceGermanyGhanaGreeceGrenadaGuatemalaGuyanaHaitiHondurasHong KongHungaryIndiaIndonesiaIranIraqIrelandIsraelItalyJamaicaJapanJordanKazakhstanKenyaKoreaKuwaitLaosLatin AmericaLatviaLebanonLiberiaLithuaniaMalaysiaMexicoMicronesiaMiddle AfricaMoldovaMoroccoNepalNetherlandsNicaraguaNigeriaNorth AmericaNorth MacedoniaNorthern AfricaNorthern EuropeNorwayOceaniaPakistanPanamaPeruPhilippinesPolandPortugalRomaniaRussiaSaudi ArabiaScotlandSenegalSerbiaSierra LeoneSingaporeSomaliaSouth AfricaSouth AmericaSouth Central AsiaSouth Eastern AsiaSouthern EuropeSpainSri LankaSt. Vincent and the GrenadinesSudanSwedenSwitzerlandSyriaTaiwanThailandTrinidad and TobagoTurkeyUgandaUkraineUruguayUzbekistanVenezuelaVietnamWest IndiesWestern AfricaWestern AsiaWestern EuropeYemenZaireZimbabweAzores
Average Family Size
Income
Poverty
Unemployment
Labor Participation
Family Structure
Vehicle Availability
Education Level
Disability

Average Family Size Comparison

Malaysians

Immigrants from Philippines

Exceptional
Exceptional
3.31
AVERAGE FAMILY SIZE
99.6/ 100
METRIC RATING
89th/ 347
METRIC RANK
3.37
AVERAGE FAMILY SIZE
100.0/ 100
METRIC RATING
43rd/ 347
METRIC RANK

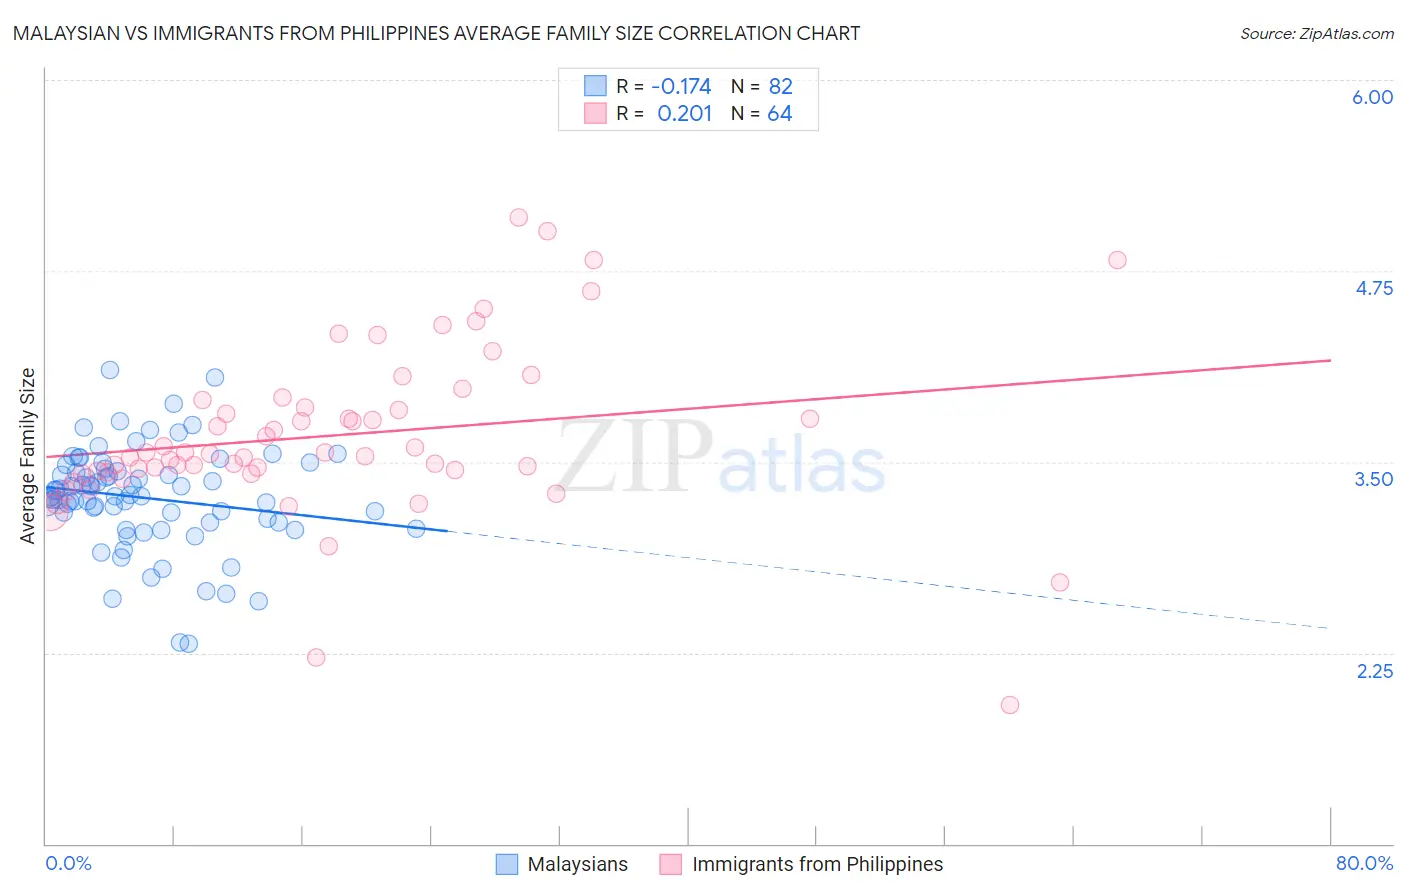
Malaysian vs Immigrants from Philippines Average Family Size Correlation Chart

The statistical analysis conducted on geographies consisting of 226,011,671 people shows a poor negative correlation between the proportion of Malaysians and average family size in the United States with a correlation coefficient (R) of -0.174 and weighted average of 3.31. Similarly, the statistical analysis conducted on geographies consisting of 471,024,108 people shows a weak positive correlation between the proportion of Immigrants from Philippines and average family size in the United States with a correlation coefficient (R) of 0.201 and weighted average of 3.37, a difference of 2.0%.
Malaysian vs Immigrants from Philippines Average Family Size

Average Family Size Correlation Summary

MeasurementMalaysianImmigrants from Philippines
Minimum2.311.91
Maximum4.105.10
Range1.793.19
Mean3.263.68
Median3.283.56
Interquartile 25% (IQ1)3.103.44
Interquartile 75% (IQ3)3.443.88
Interquartile Range (IQR)0.340.44
Standard Deviation (Sample)0.330.56
Standard Deviation (Population)0.330.56

Similar Demographics by Average Family Size

Demographics Similar to Malaysians by Average Family Size

In terms of average family size, the demographic groups most similar to Malaysians are Immigrants from Bolivia (3.31, a difference of 0.010%), Immigrants from Peru (3.31, a difference of 0.10%), Menominee (3.30, a difference of 0.11%), Jamaican (3.31, a difference of 0.15%), and Afghan (3.31, a difference of 0.17%).
DemographicsRating | RankAverage Family Size
Ecuadorians
99.8
/100
|
#82
Exceptional
3.32
Immigrants | Afghanistan
99.8
/100
|
#83
Exceptional
3.32
Immigrants | Nigeria
99.7
/100
|
#84
Exceptional
3.32
Afghans
99.7
/100
|
#85
Exceptional
3.31
Jamaicans
99.7
/100
|
#86
Exceptional
3.31
Immigrants | Peru
99.7
/100
|
#87
Exceptional
3.31
Immigrants | Bolivia
99.6
/100
|
#88
Exceptional
3.31
Malaysians
99.6
/100
|
#89
Exceptional
3.31
Menominee
99.4
/100
|
#90
Exceptional
3.30
Immigrants | Pakistan
99.2
/100
|
#91
Exceptional
3.30
Immigrants | Cameroon
99.2
/100
|
#92
Exceptional
3.30
Peruvians
99.2
/100
|
#93
Exceptional
3.30
Sierra Leoneans
99.0
/100
|
#94
Exceptional
3.30
Immigrants | Lebanon
99.0
/100
|
#95
Exceptional
3.30
U.S. Virgin Islanders
98.8
/100
|
#96
Exceptional
3.29

Demographics Similar to Immigrants from Philippines by Average Family Size

In terms of average family size, the demographic groups most similar to Immigrants from Philippines are Alaska Native (3.37, a difference of 0.010%), Shoshone (3.37, a difference of 0.040%), Immigrants from Vietnam (3.38, a difference of 0.10%), Haitian (3.37, a difference of 0.10%), and Vietnamese (3.37, a difference of 0.14%).
DemographicsRating | RankAverage Family Size
Immigrants | Guyana
100.0
/100
|
#36
Exceptional
3.40
Guyanese
100.0
/100
|
#37
Exceptional
3.40
Immigrants | Belize
100.0
/100
|
#38
Exceptional
3.39
Immigrants | Haiti
100.0
/100
|
#39
Exceptional
3.39
Belizeans
100.0
/100
|
#40
Exceptional
3.39
Marshallese
100.0
/100
|
#41
Exceptional
3.38
Immigrants | Vietnam
100.0
/100
|
#42
Exceptional
3.38
Immigrants | Philippines
100.0
/100
|
#43
Exceptional
3.37
Alaska Natives
100.0
/100
|
#44
Exceptional
3.37
Shoshone
100.0
/100
|
#45
Exceptional
3.37
Haitians
100.0
/100
|
#46
Exceptional
3.37
Vietnamese
100.0
/100
|
#47
Exceptional
3.37
Immigrants | Nicaragua
100.0
/100
|
#48
Exceptional
3.37
Bangladeshis
100.0
/100
|
#49
Exceptional
3.37
Immigrants | Bangladesh
100.0
/100
|
#50
Exceptional
3.36