Finnish vs Immigrants from Philippines Householder Income Ages 45 - 64 years
COMPARE
Finnish
Immigrants from Philippines
Householder Income Ages 45 - 64 years
Householder Income Ages 45 - 64 years Comparison
Finns
Immigrants from Philippines
$99,904
HOUSEHOLDER INCOME AGES 45 - 64 YEARS
44.8/ 100
METRIC RATING
182nd/ 347
METRIC RANK
$108,471
HOUSEHOLDER INCOME AGES 45 - 64 YEARS
98.3/ 100
METRIC RATING
90th/ 347
METRIC RANK
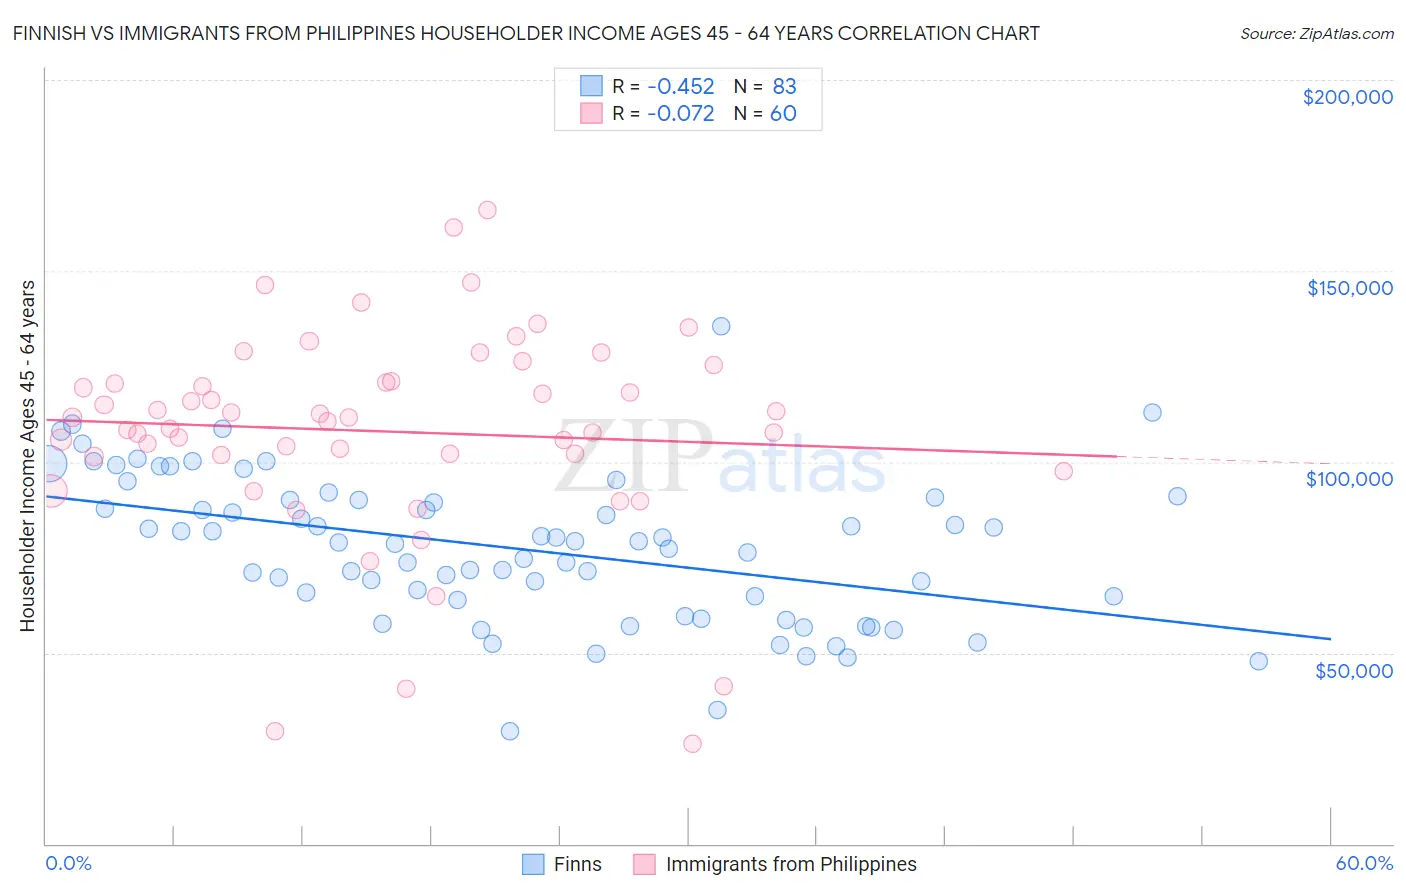
Finnish vs Immigrants from Philippines Householder Income Ages 45 - 64 years Correlation Chart
The statistical analysis conducted on geographies consisting of 404,016,937 people shows a moderate negative correlation between the proportion of Finns and household income with householder between the ages 45 and 64 in the United States with a correlation coefficient (R) of -0.452 and weighted average of $99,904. Similarly, the statistical analysis conducted on geographies consisting of 470,241,022 people shows a slight negative correlation between the proportion of Immigrants from Philippines and household income with householder between the ages 45 and 64 in the United States with a correlation coefficient (R) of -0.072 and weighted average of $108,471, a difference of 8.6%.
Householder Income Ages 45 - 64 years Correlation Summary
| Measurement | Finnish | Immigrants from Philippines |
| Minimum | $29,583 | $26,250 |
| Maximum | $135,625 | $166,010 |
| Range | $106,042 | $139,760 |
| Mean | $77,268 | $107,953 |
| Median | $78,849 | $111,076 |
| Interquartile 25% (IQ1) | $63,712 | $101,597 |
| Interquartile 75% (IQ3) | $90,163 | $120,989 |
| Interquartile Range (IQR) | $26,451 | $19,391 |
| Standard Deviation (Sample) | $19,265 | $27,383 |
| Standard Deviation (Population) | $19,148 | $27,154 |
Similar Demographics by Householder Income Ages 45 - 64 years
Demographics Similar to Finns by Householder Income Ages 45 - 64 years
In terms of householder income ages 45 - 64 years, the demographic groups most similar to Finns are Spaniard ($99,889, a difference of 0.010%), Immigrants ($99,943, a difference of 0.040%), French ($99,824, a difference of 0.080%), Colombian ($99,772, a difference of 0.13%), and Aleut ($100,052, a difference of 0.15%).
| Demographics | Rating | Rank | Householder Income Ages 45 - 64 years |
| Germans | 48.8 /100 | #175 | Average $100,224 |
| Immigrants | Costa Rica | 47.7 /100 | #176 | Average $100,141 |
| Moroccans | 47.7 /100 | #177 | Average $100,138 |
| Immigrants | Cameroon | 47.0 /100 | #178 | Average $100,084 |
| Belgians | 46.7 /100 | #179 | Average $100,060 |
| Aleuts | 46.6 /100 | #180 | Average $100,052 |
| Immigrants | Immigrants | 45.3 /100 | #181 | Average $99,943 |
| Finns | 44.8 /100 | #182 | Average $99,904 |
| Spaniards | 44.6 /100 | #183 | Average $99,889 |
| French | 43.8 /100 | #184 | Average $99,824 |
| Colombians | 43.2 /100 | #185 | Average $99,772 |
| Dutch | 41.7 /100 | #186 | Average $99,650 |
| Iraqis | 38.5 /100 | #187 | Fair $99,387 |
| Immigrants | Portugal | 36.3 /100 | #188 | Fair $99,203 |
| Immigrants | South America | 35.4 /100 | #189 | Fair $99,126 |
Demographics Similar to Immigrants from Philippines by Householder Income Ages 45 - 64 years
In terms of householder income ages 45 - 64 years, the demographic groups most similar to Immigrants from Philippines are Ukrainian ($108,475, a difference of 0.0%), Immigrants from Lebanon ($108,471, a difference of 0.0%), Croatian ($108,383, a difference of 0.080%), Romanian ($108,609, a difference of 0.13%), and Immigrants from Croatia ($108,304, a difference of 0.15%).
| Demographics | Rating | Rank | Householder Income Ages 45 - 64 years |
| Immigrants | Spain | 98.8 /100 | #83 | Exceptional $109,051 |
| Immigrants | Western Europe | 98.6 /100 | #84 | Exceptional $108,824 |
| Immigrants | Afghanistan | 98.6 /100 | #85 | Exceptional $108,785 |
| Austrians | 98.5 /100 | #86 | Exceptional $108,692 |
| Tongans | 98.5 /100 | #87 | Exceptional $108,643 |
| Romanians | 98.5 /100 | #88 | Exceptional $108,609 |
| Ukrainians | 98.3 /100 | #89 | Exceptional $108,475 |
| Immigrants | Philippines | 98.3 /100 | #90 | Exceptional $108,471 |
| Immigrants | Lebanon | 98.3 /100 | #91 | Exceptional $108,471 |
| Croatians | 98.3 /100 | #92 | Exceptional $108,383 |
| Immigrants | Croatia | 98.2 /100 | #93 | Exceptional $108,304 |
| Sri Lankans | 98.2 /100 | #94 | Exceptional $108,270 |
| Immigrants | Hungary | 98.2 /100 | #95 | Exceptional $108,267 |
| Immigrants | Argentina | 98.2 /100 | #96 | Exceptional $108,264 |
| Northern Europeans | 97.8 /100 | #97 | Exceptional $107,870 |