Egyptian vs Immigrants from Philippines Average Family Size
COMPARE
Egyptian
Immigrants from Philippines
Average Family Size
Average Family Size Comparison
Egyptians
Immigrants from Philippines
3.23
AVERAGE FAMILY SIZE
58.6/ 100
METRIC RATING
164th/ 347
METRIC RANK
3.37
AVERAGE FAMILY SIZE
100.0/ 100
METRIC RATING
43rd/ 347
METRIC RANK
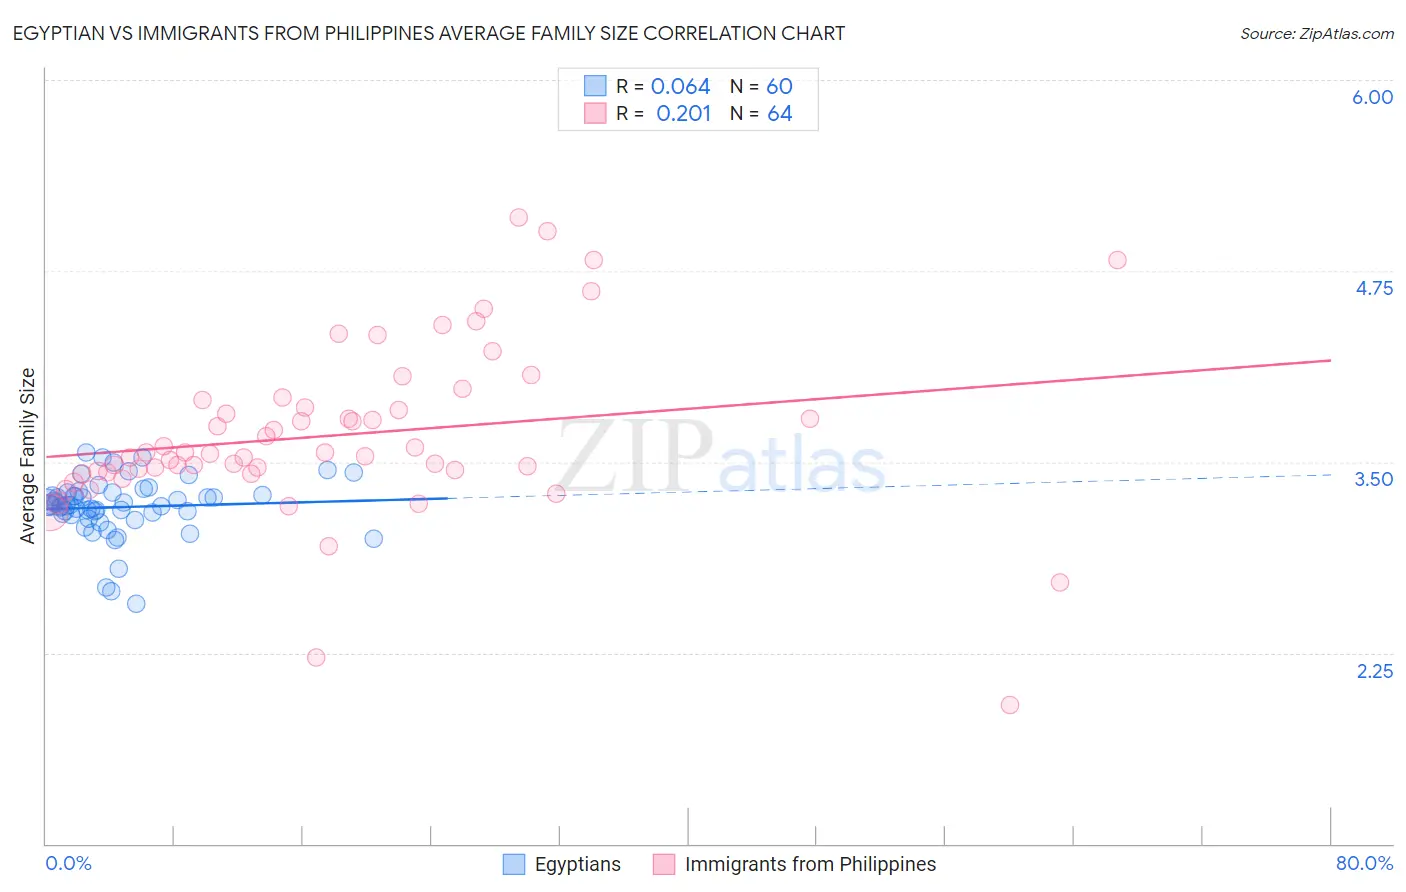
Egyptian vs Immigrants from Philippines Average Family Size Correlation Chart
The statistical analysis conducted on geographies consisting of 276,780,129 people shows a slight positive correlation between the proportion of Egyptians and average family size in the United States with a correlation coefficient (R) of 0.064 and weighted average of 3.23. Similarly, the statistical analysis conducted on geographies consisting of 471,024,108 people shows a weak positive correlation between the proportion of Immigrants from Philippines and average family size in the United States with a correlation coefficient (R) of 0.201 and weighted average of 3.37, a difference of 4.4%.
Average Family Size Correlation Summary
| Measurement | Egyptian | Immigrants from Philippines |
| Minimum | 2.57 | 1.91 |
| Maximum | 3.56 | 5.10 |
| Range | 0.99 | 3.19 |
| Mean | 3.20 | 3.68 |
| Median | 3.22 | 3.56 |
| Interquartile 25% (IQ1) | 3.16 | 3.44 |
| Interquartile 75% (IQ3) | 3.29 | 3.88 |
| Interquartile Range (IQR) | 0.13 | 0.44 |
| Standard Deviation (Sample) | 0.19 | 0.56 |
| Standard Deviation (Population) | 0.19 | 0.56 |
Similar Demographics by Average Family Size
Demographics Similar to Egyptians by Average Family Size
In terms of average family size, the demographic groups most similar to Egyptians are Uruguayan (3.23, a difference of 0.0%), Ugandan (3.23, a difference of 0.0%), Immigrants from Senegal (3.23, a difference of 0.020%), Immigrants from Uganda (3.23, a difference of 0.030%), and Dutch West Indian (3.23, a difference of 0.030%).
| Demographics | Rating | Rank | Average Family Size |
| Immigrants | Uzbekistan | 67.0 /100 | #157 | Good 3.24 |
| Iraqis | 64.3 /100 | #158 | Good 3.24 |
| Ethiopians | 63.9 /100 | #159 | Good 3.24 |
| Immigrants | Iraq | 63.7 /100 | #160 | Good 3.24 |
| Immigrants | Chile | 63.2 /100 | #161 | Good 3.24 |
| Immigrants | Uganda | 60.1 /100 | #162 | Good 3.23 |
| Uruguayans | 58.8 /100 | #163 | Average 3.23 |
| Egyptians | 58.6 /100 | #164 | Average 3.23 |
| Ugandans | 58.4 /100 | #165 | Average 3.23 |
| Immigrants | Senegal | 57.5 /100 | #166 | Average 3.23 |
| Dutch West Indians | 56.9 /100 | #167 | Average 3.23 |
| Taiwanese | 54.2 /100 | #168 | Average 3.23 |
| Aleuts | 54.1 /100 | #169 | Average 3.23 |
| Arabs | 53.8 /100 | #170 | Average 3.23 |
| Chileans | 53.2 /100 | #171 | Average 3.23 |
Demographics Similar to Immigrants from Philippines by Average Family Size
In terms of average family size, the demographic groups most similar to Immigrants from Philippines are Alaska Native (3.37, a difference of 0.010%), Shoshone (3.37, a difference of 0.040%), Immigrants from Vietnam (3.38, a difference of 0.10%), Haitian (3.37, a difference of 0.10%), and Vietnamese (3.37, a difference of 0.14%).
| Demographics | Rating | Rank | Average Family Size |
| Immigrants | Guyana | 100.0 /100 | #36 | Exceptional 3.40 |
| Guyanese | 100.0 /100 | #37 | Exceptional 3.40 |
| Immigrants | Belize | 100.0 /100 | #38 | Exceptional 3.39 |
| Immigrants | Haiti | 100.0 /100 | #39 | Exceptional 3.39 |
| Belizeans | 100.0 /100 | #40 | Exceptional 3.39 |
| Marshallese | 100.0 /100 | #41 | Exceptional 3.38 |
| Immigrants | Vietnam | 100.0 /100 | #42 | Exceptional 3.38 |
| Immigrants | Philippines | 100.0 /100 | #43 | Exceptional 3.37 |
| Alaska Natives | 100.0 /100 | #44 | Exceptional 3.37 |
| Shoshone | 100.0 /100 | #45 | Exceptional 3.37 |
| Haitians | 100.0 /100 | #46 | Exceptional 3.37 |
| Vietnamese | 100.0 /100 | #47 | Exceptional 3.37 |
| Immigrants | Nicaragua | 100.0 /100 | #48 | Exceptional 3.37 |
| Bangladeshis | 100.0 /100 | #49 | Exceptional 3.37 |
| Immigrants | Bangladesh | 100.0 /100 | #50 | Exceptional 3.36 |