Finnish vs Immigrants from Zaire Average Family Size
COMPARE
Finnish
Immigrants from Zaire
Average Family Size
Average Family Size Comparison
Finns
Immigrants from Zaire
3.09
AVERAGE FAMILY SIZE
0.0/ 100
METRIC RATING
340th/ 347
METRIC RANK
3.22
AVERAGE FAMILY SIZE
30.5/ 100
METRIC RATING
191st/ 347
METRIC RANK
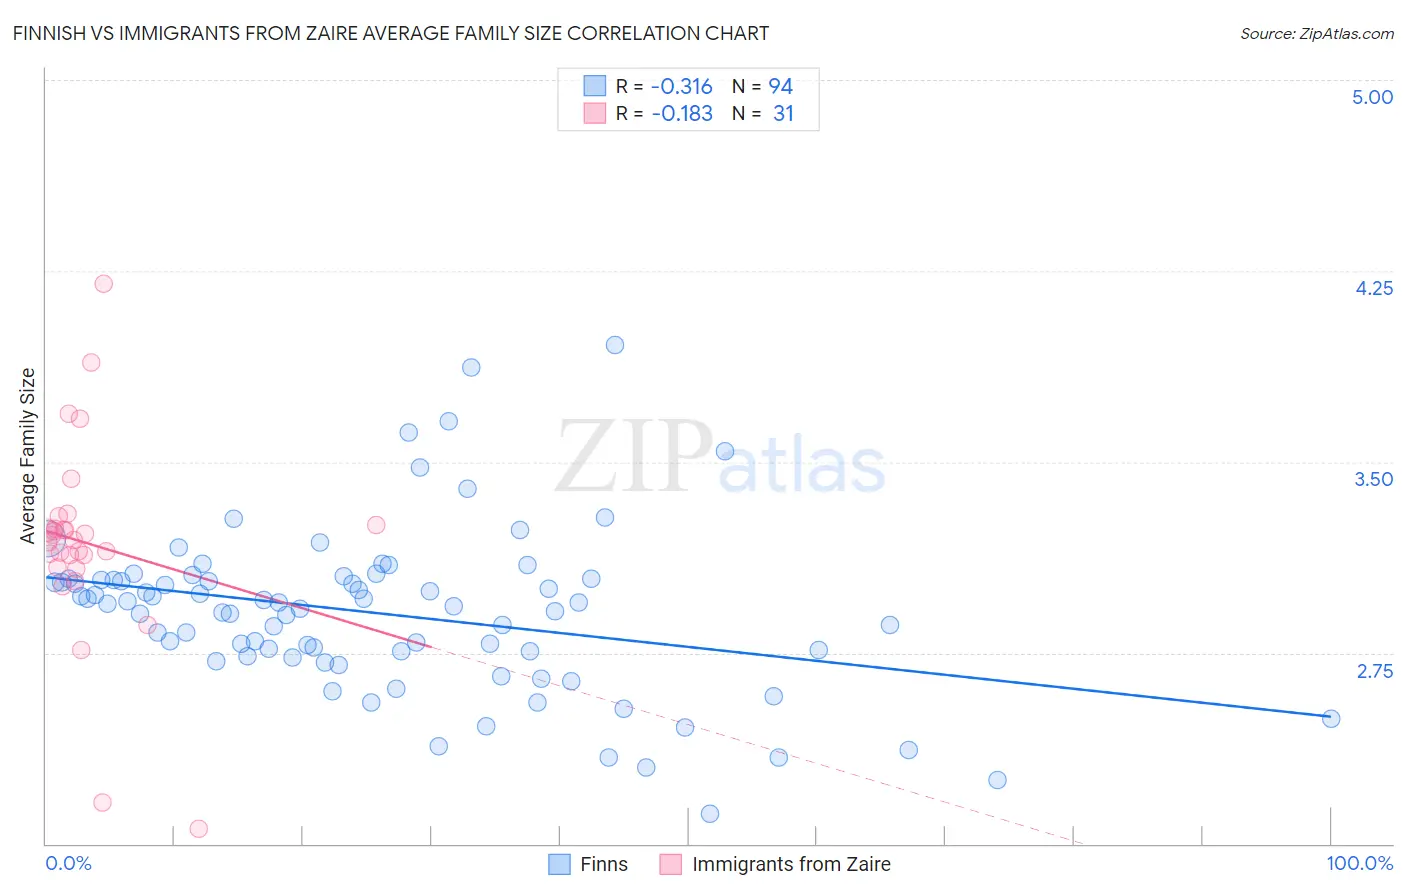
Finnish vs Immigrants from Zaire Average Family Size Correlation Chart
The statistical analysis conducted on geographies consisting of 404,508,275 people shows a mild negative correlation between the proportion of Finns and average family size in the United States with a correlation coefficient (R) of -0.316 and weighted average of 3.09. Similarly, the statistical analysis conducted on geographies consisting of 107,246,225 people shows a poor negative correlation between the proportion of Immigrants from Zaire and average family size in the United States with a correlation coefficient (R) of -0.183 and weighted average of 3.22, a difference of 3.9%.
Average Family Size Correlation Summary
| Measurement | Finnish | Immigrants from Zaire |
| Minimum | 2.12 | 2.06 |
| Maximum | 3.96 | 4.20 |
| Range | 1.84 | 2.14 |
| Mean | 2.90 | 3.18 |
| Median | 2.94 | 3.19 |
| Interquartile 25% (IQ1) | 2.74 | 3.08 |
| Interquartile 75% (IQ3) | 3.04 | 3.25 |
| Interquartile Range (IQR) | 0.30 | 0.17 |
| Standard Deviation (Sample) | 0.32 | 0.40 |
| Standard Deviation (Population) | 0.32 | 0.39 |
Similar Demographics by Average Family Size
Demographics Similar to Finns by Average Family Size
In terms of average family size, the demographic groups most similar to Finns are Polish (3.09, a difference of 0.050%), Croatian (3.10, a difference of 0.14%), French (3.10, a difference of 0.16%), Swedish (3.10, a difference of 0.18%), and German (3.09, a difference of 0.19%).
| Demographics | Rating | Rank | Average Family Size |
| Estonians | 0.0 /100 | #333 | Tragic 3.10 |
| Lithuanians | 0.0 /100 | #334 | Tragic 3.10 |
| Luxembourgers | 0.0 /100 | #335 | Tragic 3.10 |
| Irish | 0.0 /100 | #336 | Tragic 3.10 |
| Swedes | 0.0 /100 | #337 | Tragic 3.10 |
| French | 0.0 /100 | #338 | Tragic 3.10 |
| Croatians | 0.0 /100 | #339 | Tragic 3.10 |
| Finns | 0.0 /100 | #340 | Tragic 3.09 |
| Poles | 0.0 /100 | #341 | Tragic 3.09 |
| Germans | 0.0 /100 | #342 | Tragic 3.09 |
| Norwegians | 0.0 /100 | #343 | Tragic 3.08 |
| French Canadians | 0.0 /100 | #344 | Tragic 3.07 |
| Slovenes | 0.0 /100 | #345 | Tragic 3.07 |
| Slovaks | 0.0 /100 | #346 | Tragic 3.06 |
| Carpatho Rusyns | 0.0 /100 | #347 | Tragic 3.06 |
Demographics Similar to Immigrants from Zaire by Average Family Size
In terms of average family size, the demographic groups most similar to Immigrants from Zaire are Burmese (3.22, a difference of 0.010%), Immigrants from Eastern Africa (3.22, a difference of 0.010%), Immigrants from Israel (3.22, a difference of 0.030%), Immigrants from Sudan (3.22, a difference of 0.030%), and Choctaw (3.21, a difference of 0.050%).
| Demographics | Rating | Rank | Average Family Size |
| Immigrants | Eastern Asia | 40.8 /100 | #184 | Average 3.22 |
| Immigrants | Sri Lanka | 39.8 /100 | #185 | Fair 3.22 |
| Immigrants | Argentina | 39.8 /100 | #186 | Fair 3.22 |
| Immigrants | Malaysia | 39.0 /100 | #187 | Fair 3.22 |
| Thais | 38.3 /100 | #188 | Fair 3.22 |
| Pakistanis | 33.7 /100 | #189 | Fair 3.22 |
| Burmese | 31.0 /100 | #190 | Fair 3.22 |
| Immigrants | Zaire | 30.5 /100 | #191 | Fair 3.22 |
| Immigrants | Eastern Africa | 30.1 /100 | #192 | Fair 3.22 |
| Immigrants | Israel | 29.3 /100 | #193 | Fair 3.22 |
| Immigrants | Sudan | 29.1 /100 | #194 | Fair 3.22 |
| Choctaw | 28.3 /100 | #195 | Fair 3.21 |
| Senegalese | 28.2 /100 | #196 | Fair 3.21 |
| Kenyans | 28.0 /100 | #197 | Fair 3.21 |
| Immigrants | Azores | 21.7 /100 | #198 | Fair 3.21 |