Immigrants from Grenada vs Immigrants from Philippines Average Family Size
COMPARE
Immigrants from Grenada
Immigrants from Philippines
Average Family Size
Average Family Size Comparison
Immigrants from Grenada
Immigrants from Philippines
3.34
AVERAGE FAMILY SIZE
100.0/ 100
METRIC RATING
62nd/ 347
METRIC RANK
3.37
AVERAGE FAMILY SIZE
100.0/ 100
METRIC RATING
43rd/ 347
METRIC RANK
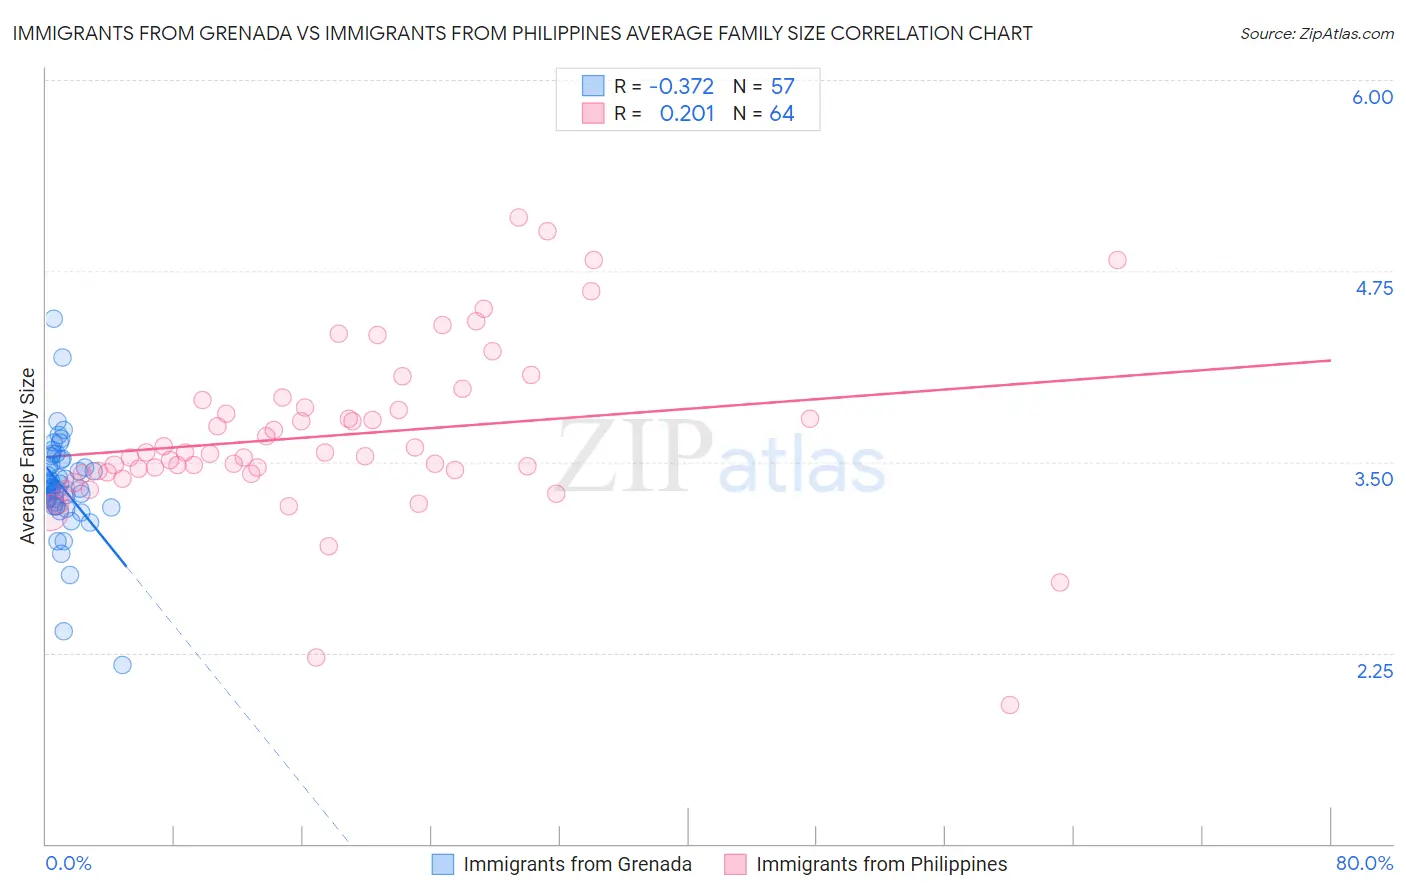
Immigrants from Grenada vs Immigrants from Philippines Average Family Size Correlation Chart
The statistical analysis conducted on geographies consisting of 67,189,874 people shows a mild negative correlation between the proportion of Immigrants from Grenada and average family size in the United States with a correlation coefficient (R) of -0.372 and weighted average of 3.34. Similarly, the statistical analysis conducted on geographies consisting of 471,024,108 people shows a weak positive correlation between the proportion of Immigrants from Philippines and average family size in the United States with a correlation coefficient (R) of 0.201 and weighted average of 3.37, a difference of 1.0%.
Average Family Size Correlation Summary
| Measurement | Immigrants from Grenada | Immigrants from Philippines |
| Minimum | 2.17 | 1.91 |
| Maximum | 4.44 | 5.10 |
| Range | 2.27 | 3.19 |
| Mean | 3.34 | 3.68 |
| Median | 3.33 | 3.56 |
| Interquartile 25% (IQ1) | 3.21 | 3.44 |
| Interquartile 75% (IQ3) | 3.50 | 3.88 |
| Interquartile Range (IQR) | 0.29 | 0.44 |
| Standard Deviation (Sample) | 0.34 | 0.56 |
| Standard Deviation (Population) | 0.33 | 0.56 |
Demographics Similar to Immigrants from Grenada and Immigrants from Philippines by Average Family Size
In terms of average family size, the demographic groups most similar to Immigrants from Grenada are Central American Indian (3.35, a difference of 0.19%), Immigrants from Armenia (3.35, a difference of 0.21%), Japanese (3.35, a difference of 0.24%), Honduran (3.35, a difference of 0.33%), and Sri Lankan (3.35, a difference of 0.34%). Similarly, the demographic groups most similar to Immigrants from Philippines are Alaska Native (3.37, a difference of 0.010%), Shoshone (3.37, a difference of 0.040%), Immigrants from Vietnam (3.38, a difference of 0.10%), Haitian (3.37, a difference of 0.10%), and Vietnamese (3.37, a difference of 0.14%).
| Demographics | Rating | Rank | Average Family Size |
| Immigrants | Vietnam | 100.0 /100 | #42 | Exceptional 3.38 |
| Immigrants | Philippines | 100.0 /100 | #43 | Exceptional 3.37 |
| Alaska Natives | 100.0 /100 | #44 | Exceptional 3.37 |
| Shoshone | 100.0 /100 | #45 | Exceptional 3.37 |
| Haitians | 100.0 /100 | #46 | Exceptional 3.37 |
| Vietnamese | 100.0 /100 | #47 | Exceptional 3.37 |
| Immigrants | Nicaragua | 100.0 /100 | #48 | Exceptional 3.37 |
| Bangladeshis | 100.0 /100 | #49 | Exceptional 3.37 |
| Immigrants | Bangladesh | 100.0 /100 | #50 | Exceptional 3.36 |
| Nicaraguans | 100.0 /100 | #51 | Exceptional 3.36 |
| Fijians | 100.0 /100 | #52 | Exceptional 3.36 |
| Koreans | 100.0 /100 | #53 | Exceptional 3.36 |
| Immigrants | South Eastern Asia | 100.0 /100 | #54 | Exceptional 3.36 |
| Immigrants | Honduras | 100.0 /100 | #55 | Exceptional 3.36 |
| Immigrants | Dominican Republic | 100.0 /100 | #56 | Exceptional 3.35 |
| Sri Lankans | 100.0 /100 | #57 | Exceptional 3.35 |
| Hondurans | 100.0 /100 | #58 | Exceptional 3.35 |
| Japanese | 100.0 /100 | #59 | Exceptional 3.35 |
| Immigrants | Armenia | 100.0 /100 | #60 | Exceptional 3.35 |
| Central American Indians | 100.0 /100 | #61 | Exceptional 3.35 |
| Immigrants | Grenada | 100.0 /100 | #62 | Exceptional 3.34 |