Hispanic or Latino vs Immigrants from Philippines Average Family Size
COMPARE
Hispanic or Latino
Immigrants from Philippines
Average Family Size
Average Family Size Comparison
Hispanics or Latinos
Immigrants from Philippines
3.41
AVERAGE FAMILY SIZE
100.0/ 100
METRIC RATING
34th/ 347
METRIC RANK
3.37
AVERAGE FAMILY SIZE
100.0/ 100
METRIC RATING
43rd/ 347
METRIC RANK
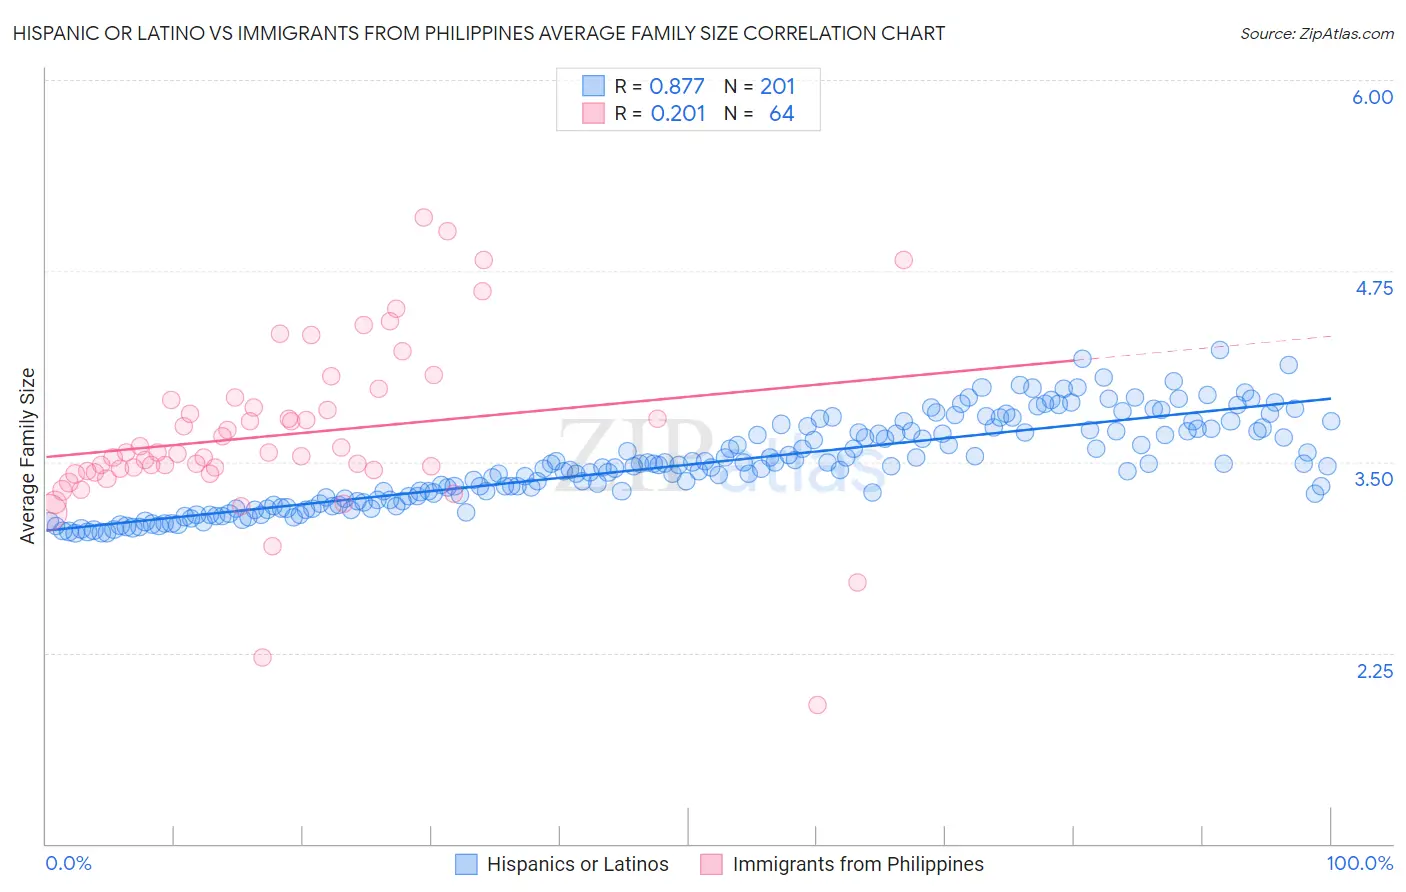
Hispanic or Latino vs Immigrants from Philippines Average Family Size Correlation Chart
The statistical analysis conducted on geographies consisting of 577,913,054 people shows a very strong positive correlation between the proportion of Hispanics or Latinos and average family size in the United States with a correlation coefficient (R) of 0.877 and weighted average of 3.41. Similarly, the statistical analysis conducted on geographies consisting of 471,024,108 people shows a weak positive correlation between the proportion of Immigrants from Philippines and average family size in the United States with a correlation coefficient (R) of 0.201 and weighted average of 3.37, a difference of 0.94%.
Average Family Size Correlation Summary
| Measurement | Hispanic or Latino | Immigrants from Philippines |
| Minimum | 3.03 | 1.91 |
| Maximum | 4.23 | 5.10 |
| Range | 1.20 | 3.19 |
| Mean | 3.48 | 3.68 |
| Median | 3.47 | 3.56 |
| Interquartile 25% (IQ1) | 3.24 | 3.44 |
| Interquartile 75% (IQ3) | 3.71 | 3.88 |
| Interquartile Range (IQR) | 0.47 | 0.44 |
| Standard Deviation (Sample) | 0.29 | 0.56 |
| Standard Deviation (Population) | 0.29 | 0.56 |
Demographics Similar to Hispanics or Latinos and Immigrants from Philippines by Average Family Size
In terms of average family size, the demographic groups most similar to Hispanics or Latinos are Hawaiian (3.41, a difference of 0.050%), Guatemalan (3.40, a difference of 0.060%), Immigrants from Guatemala (3.41, a difference of 0.080%), Immigrants from Guyana (3.40, a difference of 0.11%), and Central American (3.41, a difference of 0.18%). Similarly, the demographic groups most similar to Immigrants from Philippines are Alaska Native (3.37, a difference of 0.010%), Shoshone (3.37, a difference of 0.040%), Immigrants from Vietnam (3.38, a difference of 0.10%), Haitian (3.37, a difference of 0.10%), and Vietnamese (3.37, a difference of 0.14%).
| Demographics | Rating | Rank | Average Family Size |
| Immigrants | Latin America | 100.0 /100 | #28 | Exceptional 3.42 |
| Nepalese | 100.0 /100 | #29 | Exceptional 3.42 |
| Samoans | 100.0 /100 | #30 | Exceptional 3.42 |
| Central Americans | 100.0 /100 | #31 | Exceptional 3.41 |
| Immigrants | Guatemala | 100.0 /100 | #32 | Exceptional 3.41 |
| Hawaiians | 100.0 /100 | #33 | Exceptional 3.41 |
| Hispanics or Latinos | 100.0 /100 | #34 | Exceptional 3.41 |
| Guatemalans | 100.0 /100 | #35 | Exceptional 3.40 |
| Immigrants | Guyana | 100.0 /100 | #36 | Exceptional 3.40 |
| Guyanese | 100.0 /100 | #37 | Exceptional 3.40 |
| Immigrants | Belize | 100.0 /100 | #38 | Exceptional 3.39 |
| Immigrants | Haiti | 100.0 /100 | #39 | Exceptional 3.39 |
| Belizeans | 100.0 /100 | #40 | Exceptional 3.39 |
| Marshallese | 100.0 /100 | #41 | Exceptional 3.38 |
| Immigrants | Vietnam | 100.0 /100 | #42 | Exceptional 3.38 |
| Immigrants | Philippines | 100.0 /100 | #43 | Exceptional 3.37 |
| Alaska Natives | 100.0 /100 | #44 | Exceptional 3.37 |
| Shoshone | 100.0 /100 | #45 | Exceptional 3.37 |
| Haitians | 100.0 /100 | #46 | Exceptional 3.37 |
| Vietnamese | 100.0 /100 | #47 | Exceptional 3.37 |
| Immigrants | Nicaragua | 100.0 /100 | #48 | Exceptional 3.37 |