Finnish vs Immigrants from Asia Average Family Size
COMPARE
Finnish
Immigrants from Asia
Average Family Size
Average Family Size Comparison
Finns
Immigrants from Asia
3.09
AVERAGE FAMILY SIZE
0.0/ 100
METRIC RATING
340th/ 347
METRIC RANK
3.27
AVERAGE FAMILY SIZE
94.0/ 100
METRIC RATING
118th/ 347
METRIC RANK
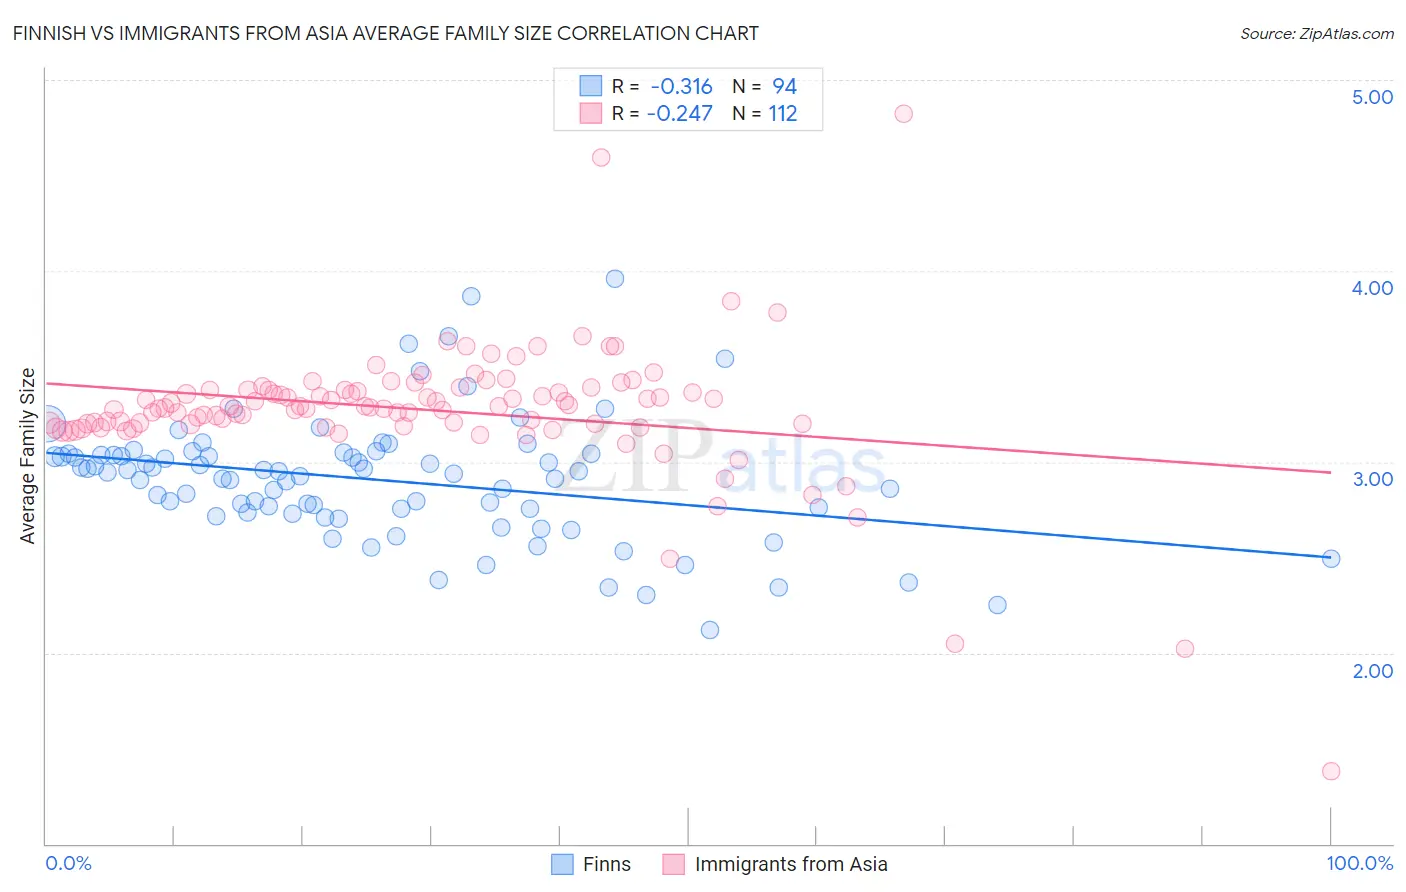
Finnish vs Immigrants from Asia Average Family Size Correlation Chart
The statistical analysis conducted on geographies consisting of 404,508,275 people shows a mild negative correlation between the proportion of Finns and average family size in the United States with a correlation coefficient (R) of -0.316 and weighted average of 3.09. Similarly, the statistical analysis conducted on geographies consisting of 548,543,800 people shows a weak negative correlation between the proportion of Immigrants from Asia and average family size in the United States with a correlation coefficient (R) of -0.247 and weighted average of 3.27, a difference of 5.6%.
Average Family Size Correlation Summary
| Measurement | Finnish | Immigrants from Asia |
| Minimum | 2.12 | 1.38 |
| Maximum | 3.96 | 4.82 |
| Range | 1.84 | 3.44 |
| Mean | 2.90 | 3.27 |
| Median | 2.94 | 3.29 |
| Interquartile 25% (IQ1) | 2.74 | 3.20 |
| Interquartile 75% (IQ3) | 3.04 | 3.38 |
| Interquartile Range (IQR) | 0.30 | 0.18 |
| Standard Deviation (Sample) | 0.32 | 0.37 |
| Standard Deviation (Population) | 0.32 | 0.36 |
Similar Demographics by Average Family Size
Demographics Similar to Finns by Average Family Size
In terms of average family size, the demographic groups most similar to Finns are Polish (3.09, a difference of 0.050%), Croatian (3.10, a difference of 0.14%), French (3.10, a difference of 0.16%), Swedish (3.10, a difference of 0.18%), and German (3.09, a difference of 0.19%).
| Demographics | Rating | Rank | Average Family Size |
| Estonians | 0.0 /100 | #333 | Tragic 3.10 |
| Lithuanians | 0.0 /100 | #334 | Tragic 3.10 |
| Luxembourgers | 0.0 /100 | #335 | Tragic 3.10 |
| Irish | 0.0 /100 | #336 | Tragic 3.10 |
| Swedes | 0.0 /100 | #337 | Tragic 3.10 |
| French | 0.0 /100 | #338 | Tragic 3.10 |
| Croatians | 0.0 /100 | #339 | Tragic 3.10 |
| Finns | 0.0 /100 | #340 | Tragic 3.09 |
| Poles | 0.0 /100 | #341 | Tragic 3.09 |
| Germans | 0.0 /100 | #342 | Tragic 3.09 |
| Norwegians | 0.0 /100 | #343 | Tragic 3.08 |
| French Canadians | 0.0 /100 | #344 | Tragic 3.07 |
| Slovenes | 0.0 /100 | #345 | Tragic 3.07 |
| Slovaks | 0.0 /100 | #346 | Tragic 3.06 |
| Carpatho Rusyns | 0.0 /100 | #347 | Tragic 3.06 |
Demographics Similar to Immigrants from Asia by Average Family Size
In terms of average family size, the demographic groups most similar to Immigrants from Asia are Immigrants from Indonesia (3.27, a difference of 0.020%), Immigrants from Bahamas (3.27, a difference of 0.030%), Immigrants from Thailand (3.27, a difference of 0.050%), Kiowa (3.27, a difference of 0.070%), and Immigrants from Liberia (3.27, a difference of 0.090%).
| Demographics | Rating | Rank | Average Family Size |
| Indonesians | 96.2 /100 | #111 | Exceptional 3.28 |
| Blacks/African Americans | 95.7 /100 | #112 | Exceptional 3.27 |
| Immigrants | Panama | 95.6 /100 | #113 | Exceptional 3.27 |
| South Americans | 95.1 /100 | #114 | Exceptional 3.27 |
| Immigrants | Liberia | 95.0 /100 | #115 | Exceptional 3.27 |
| Immigrants | South America | 95.0 /100 | #116 | Exceptional 3.27 |
| Kiowa | 94.8 /100 | #117 | Exceptional 3.27 |
| Immigrants | Asia | 94.0 /100 | #118 | Exceptional 3.27 |
| Immigrants | Indonesia | 93.7 /100 | #119 | Exceptional 3.27 |
| Immigrants | Bahamas | 93.6 /100 | #120 | Exceptional 3.27 |
| Immigrants | Thailand | 93.3 /100 | #121 | Exceptional 3.27 |
| Immigrants | Colombia | 92.8 /100 | #122 | Exceptional 3.27 |
| Alaskan Athabascans | 92.4 /100 | #123 | Exceptional 3.27 |
| South American Indians | 91.6 /100 | #124 | Exceptional 3.26 |
| Immigrants | Cuba | 91.3 /100 | #125 | Exceptional 3.26 |