Finnish vs Immigrants from Bulgaria Divorced or Separated
COMPARE
Finnish
Immigrants from Bulgaria
Divorced or Separated
Divorced or Separated Comparison
Finns
Immigrants from Bulgaria
12.5%
DIVORCED OR SEPARATED
1.8/ 100
METRIC RATING
249th/ 347
METRIC RANK
11.5%
DIVORCED OR SEPARATED
99.3/ 100
METRIC RATING
83rd/ 347
METRIC RANK
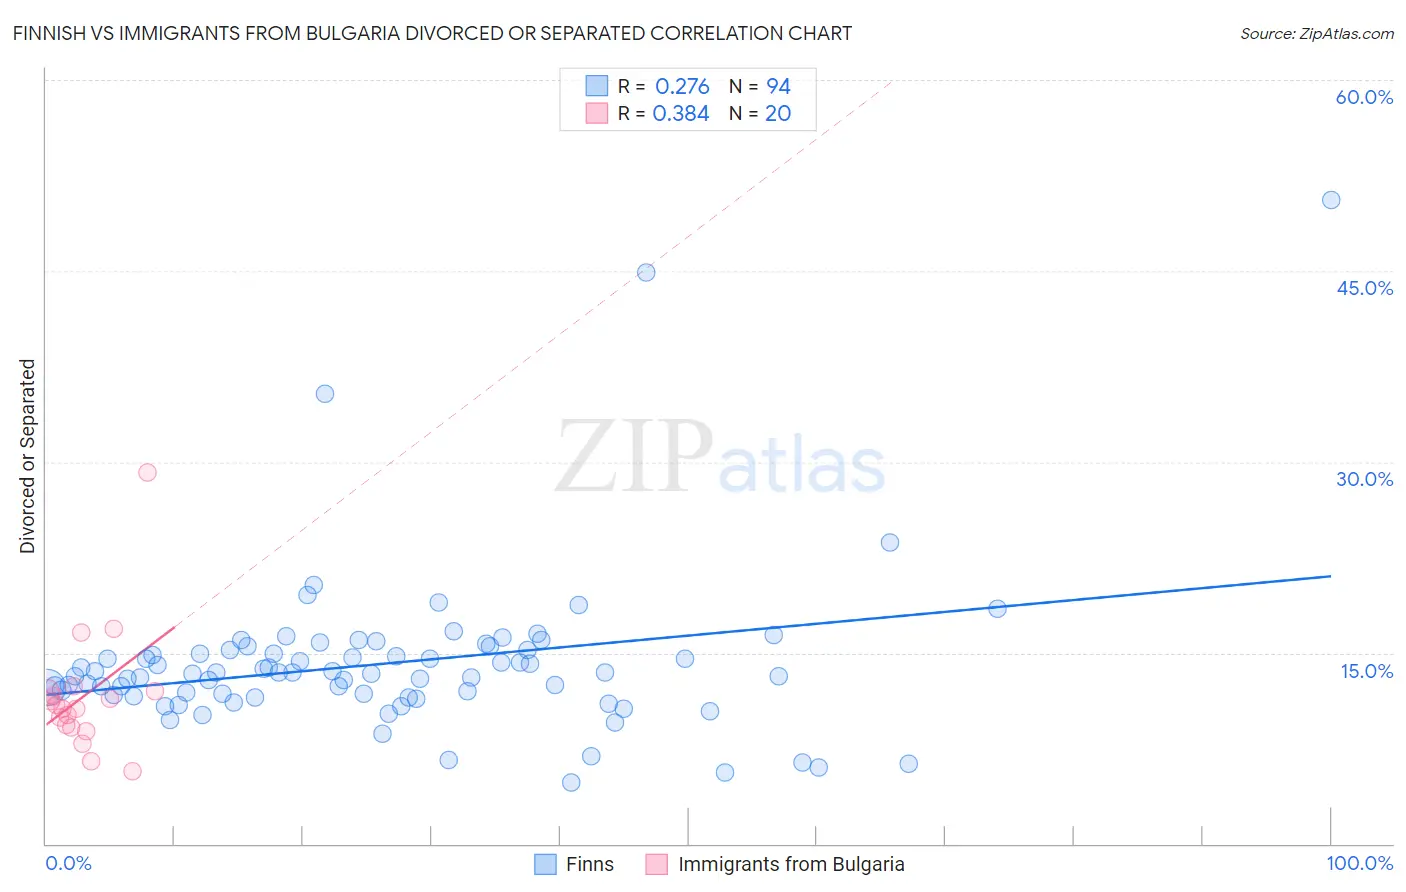
Finnish vs Immigrants from Bulgaria Divorced or Separated Correlation Chart
The statistical analysis conducted on geographies consisting of 404,587,172 people shows a weak positive correlation between the proportion of Finns and percentage of population currently divorced or separated in the United States with a correlation coefficient (R) of 0.276 and weighted average of 12.5%. Similarly, the statistical analysis conducted on geographies consisting of 172,542,823 people shows a mild positive correlation between the proportion of Immigrants from Bulgaria and percentage of population currently divorced or separated in the United States with a correlation coefficient (R) of 0.384 and weighted average of 11.5%, a difference of 8.2%.
Divorced or Separated Correlation Summary
| Measurement | Finnish | Immigrants from Bulgaria |
| Minimum | 4.8% | 5.7% |
| Maximum | 50.5% | 29.2% |
| Range | 45.7% | 23.5% |
| Mean | 14.1% | 11.6% |
| Median | 13.4% | 10.8% |
| Interquartile 25% (IQ1) | 11.7% | 9.2% |
| Interquartile 75% (IQ3) | 15.2% | 12.0% |
| Interquartile Range (IQR) | 3.5% | 2.7% |
| Standard Deviation (Sample) | 6.3% | 4.9% |
| Standard Deviation (Population) | 6.3% | 4.8% |
Similar Demographics by Divorced or Separated
Demographics Similar to Finns by Divorced or Separated
In terms of divorced or separated, the demographic groups most similar to Finns are Nepalese (12.5%, a difference of 0.010%), German (12.5%, a difference of 0.040%), Immigrants from West Indies (12.5%, a difference of 0.070%), Hispanic or Latino (12.5%, a difference of 0.090%), and Irish (12.5%, a difference of 0.27%).
| Demographics | Rating | Rank | Divorced or Separated |
| Dutch | 3.1 /100 | #242 | Tragic 12.4% |
| Immigrants | Latin America | 2.8 /100 | #243 | Tragic 12.4% |
| Alaska Natives | 2.5 /100 | #244 | Tragic 12.4% |
| Hispanics or Latinos | 2.0 /100 | #245 | Tragic 12.5% |
| Immigrants | West Indies | 1.9 /100 | #246 | Tragic 12.5% |
| Germans | 1.8 /100 | #247 | Tragic 12.5% |
| Nepalese | 1.8 /100 | #248 | Tragic 12.5% |
| Finns | 1.8 /100 | #249 | Tragic 12.5% |
| Irish | 1.3 /100 | #250 | Tragic 12.5% |
| Aleuts | 1.3 /100 | #251 | Tragic 12.5% |
| Liberians | 0.9 /100 | #252 | Tragic 12.6% |
| Somalis | 0.9 /100 | #253 | Tragic 12.6% |
| Senegalese | 0.8 /100 | #254 | Tragic 12.6% |
| Welsh | 0.7 /100 | #255 | Tragic 12.6% |
| Immigrants | Colombia | 0.6 /100 | #256 | Tragic 12.6% |
Demographics Similar to Immigrants from Bulgaria by Divorced or Separated
In terms of divorced or separated, the demographic groups most similar to Immigrants from Bulgaria are Bulgarian (11.5%, a difference of 0.020%), Immigrants from Romania (11.5%, a difference of 0.030%), Immigrants from Albania (11.5%, a difference of 0.080%), Russian (11.5%, a difference of 0.11%), and Immigrants from Switzerland (11.5%, a difference of 0.12%).
| Demographics | Rating | Rank | Divorced or Separated |
| Albanians | 99.6 /100 | #76 | Exceptional 11.5% |
| Immigrants | Italy | 99.5 /100 | #77 | Exceptional 11.5% |
| Afghans | 99.4 /100 | #78 | Exceptional 11.5% |
| Guyanese | 99.4 /100 | #79 | Exceptional 11.5% |
| Immigrants | Switzerland | 99.4 /100 | #80 | Exceptional 11.5% |
| Russians | 99.4 /100 | #81 | Exceptional 11.5% |
| Immigrants | Romania | 99.3 /100 | #82 | Exceptional 11.5% |
| Immigrants | Bulgaria | 99.3 /100 | #83 | Exceptional 11.5% |
| Bulgarians | 99.3 /100 | #84 | Exceptional 11.5% |
| Immigrants | Albania | 99.3 /100 | #85 | Exceptional 11.5% |
| Immigrants | Latvia | 99.2 /100 | #86 | Exceptional 11.6% |
| Immigrants | Nepal | 99.2 /100 | #87 | Exceptional 11.6% |
| Immigrants | Europe | 99.2 /100 | #88 | Exceptional 11.6% |
| Immigrants | Southern Europe | 99.1 /100 | #89 | Exceptional 11.6% |
| Zimbabweans | 99.0 /100 | #90 | Exceptional 11.6% |