Ethiopian vs Thai Householder Income Under 25 years
COMPARE
Ethiopian
Thai
Householder Income Under 25 years
Householder Income Under 25 years Comparison
Ethiopians
Thais
$53,818
HOUSEHOLDER INCOME UNDER 25 YEARS
98.2/ 100
METRIC RATING
104th/ 347
METRIC RANK
$59,187
HOUSEHOLDER INCOME UNDER 25 YEARS
100.0/ 100
METRIC RATING
6th/ 347
METRIC RANK
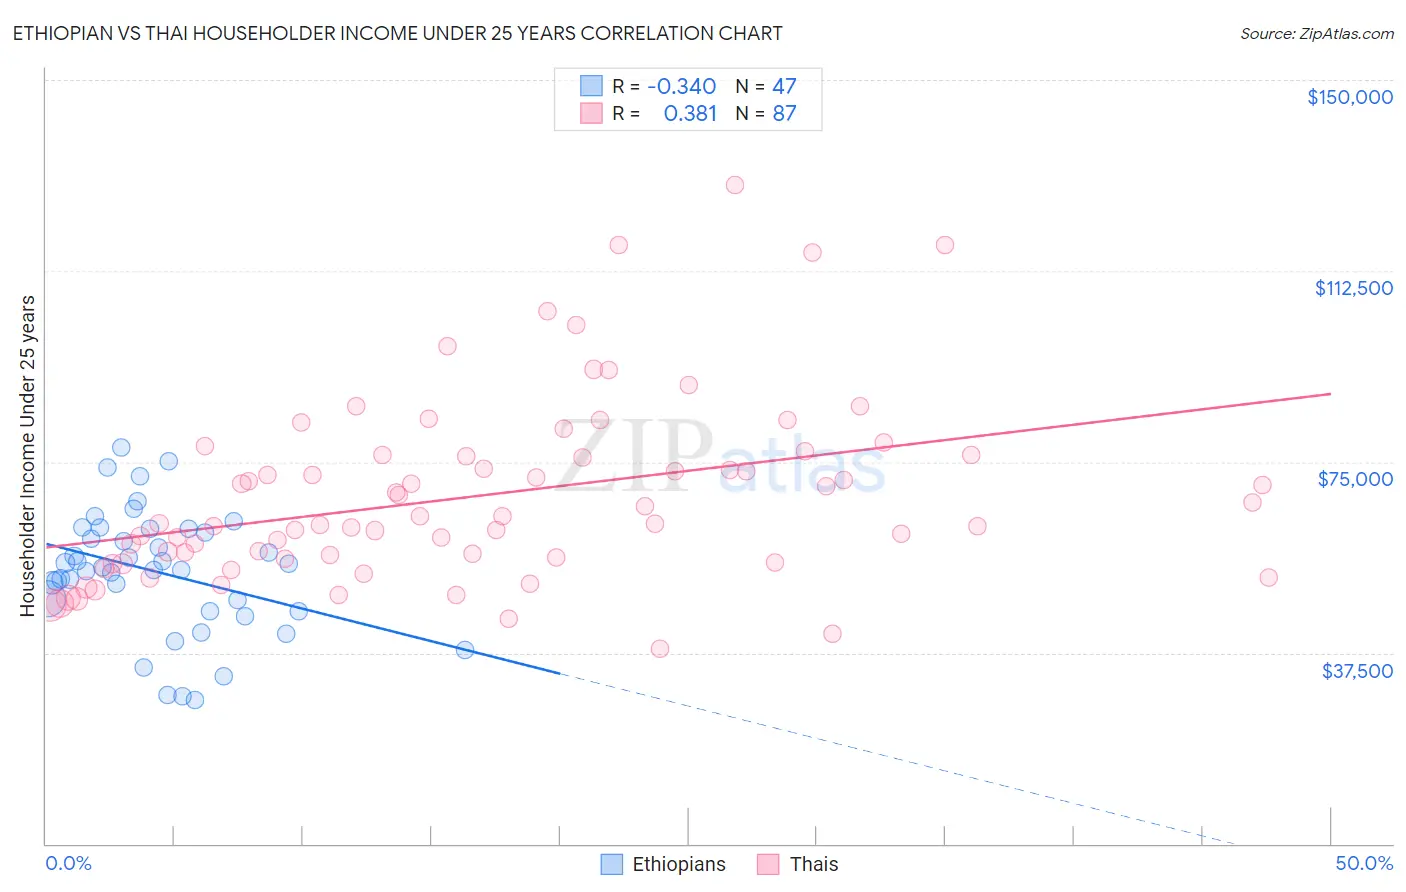
Ethiopian vs Thai Householder Income Under 25 years Correlation Chart
The statistical analysis conducted on geographies consisting of 201,530,773 people shows a mild negative correlation between the proportion of Ethiopians and household income with householder under the age of 25 in the United States with a correlation coefficient (R) of -0.340 and weighted average of $53,818. Similarly, the statistical analysis conducted on geographies consisting of 390,520,827 people shows a mild positive correlation between the proportion of Thais and household income with householder under the age of 25 in the United States with a correlation coefficient (R) of 0.381 and weighted average of $59,187, a difference of 10.0%.
Householder Income Under 25 years Correlation Summary
| Measurement | Ethiopian | Thai |
| Minimum | $28,125 | $38,359 |
| Maximum | $77,898 | $129,301 |
| Range | $49,773 | $90,942 |
| Mean | $53,404 | $68,286 |
| Median | $54,292 | $62,959 |
| Interquartile 25% (IQ1) | $45,695 | $56,029 |
| Interquartile 75% (IQ3) | $61,784 | $76,245 |
| Interquartile Range (IQR) | $16,089 | $20,216 |
| Standard Deviation (Sample) | $11,871 | $17,960 |
| Standard Deviation (Population) | $11,744 | $17,857 |
Similar Demographics by Householder Income Under 25 years
Demographics Similar to Ethiopians by Householder Income Under 25 years
In terms of householder income under 25 years, the demographic groups most similar to Ethiopians are Immigrants from France ($53,805, a difference of 0.020%), Ukrainian ($53,843, a difference of 0.050%), Albanian ($53,794, a difference of 0.050%), Australian ($53,739, a difference of 0.15%), and Maltese ($53,735, a difference of 0.15%).
| Demographics | Rating | Rank | Householder Income Under 25 years |
| Immigrants | Portugal | 99.1 /100 | #97 | Exceptional $54,105 |
| Eastern Europeans | 99.0 /100 | #98 | Exceptional $54,066 |
| Alaska Natives | 98.8 /100 | #99 | Exceptional $54,000 |
| Immigrants | Kazakhstan | 98.8 /100 | #100 | Exceptional $53,990 |
| South Americans | 98.6 /100 | #101 | Exceptional $53,939 |
| Ecuadorians | 98.5 /100 | #102 | Exceptional $53,911 |
| Ukrainians | 98.3 /100 | #103 | Exceptional $53,843 |
| Ethiopians | 98.2 /100 | #104 | Exceptional $53,818 |
| Immigrants | France | 98.1 /100 | #105 | Exceptional $53,805 |
| Albanians | 98.1 /100 | #106 | Exceptional $53,794 |
| Australians | 97.8 /100 | #107 | Exceptional $53,739 |
| Maltese | 97.8 /100 | #108 | Exceptional $53,735 |
| Immigrants | Ecuador | 97.7 /100 | #109 | Exceptional $53,722 |
| Greeks | 97.7 /100 | #110 | Exceptional $53,715 |
| Immigrants | Colombia | 97.7 /100 | #111 | Exceptional $53,714 |
Demographics Similar to Thais by Householder Income Under 25 years
In terms of householder income under 25 years, the demographic groups most similar to Thais are Immigrants from Bolivia ($59,389, a difference of 0.34%), Immigrants from Taiwan ($59,424, a difference of 0.40%), Bolivian ($58,506, a difference of 1.2%), Immigrants from India ($59,914, a difference of 1.2%), and Indian (Asian) ($58,239, a difference of 1.6%).
| Demographics | Rating | Rank | Householder Income Under 25 years |
| Assyrians/Chaldeans/Syriacs | 100.0 /100 | #1 | Exceptional $65,329 |
| Immigrants | Hong Kong | 100.0 /100 | #2 | Exceptional $62,083 |
| Immigrants | India | 100.0 /100 | #3 | Exceptional $59,914 |
| Immigrants | Taiwan | 100.0 /100 | #4 | Exceptional $59,424 |
| Immigrants | Bolivia | 100.0 /100 | #5 | Exceptional $59,389 |
| Thais | 100.0 /100 | #6 | Exceptional $59,187 |
| Bolivians | 100.0 /100 | #7 | Exceptional $58,506 |
| Indians (Asian) | 100.0 /100 | #8 | Exceptional $58,239 |
| Chinese | 100.0 /100 | #9 | Exceptional $58,162 |
| Afghans | 100.0 /100 | #10 | Exceptional $58,019 |
| Immigrants | China | 100.0 /100 | #11 | Exceptional $57,931 |
| Immigrants | Philippines | 100.0 /100 | #12 | Exceptional $57,930 |
| Immigrants | South Central Asia | 100.0 /100 | #13 | Exceptional $57,818 |
| Filipinos | 100.0 /100 | #14 | Exceptional $57,740 |
| Koreans | 100.0 /100 | #15 | Exceptional $57,730 |