Ethiopian vs Thai Unemployment Among Ages 60 to 64 years
COMPARE
Ethiopian
Thai
Unemployment Among Ages 60 to 64 years
Unemployment Among Ages 60 to 64 years Comparison
Ethiopians
Thais
4.7%
UNEMPLOYMENT AMONG AGES 60 TO 64 YEARS
97.2/ 100
METRIC RATING
110th/ 347
METRIC RANK
4.7%
UNEMPLOYMENT AMONG AGES 60 TO 64 YEARS
98.9/ 100
METRIC RATING
84th/ 347
METRIC RANK
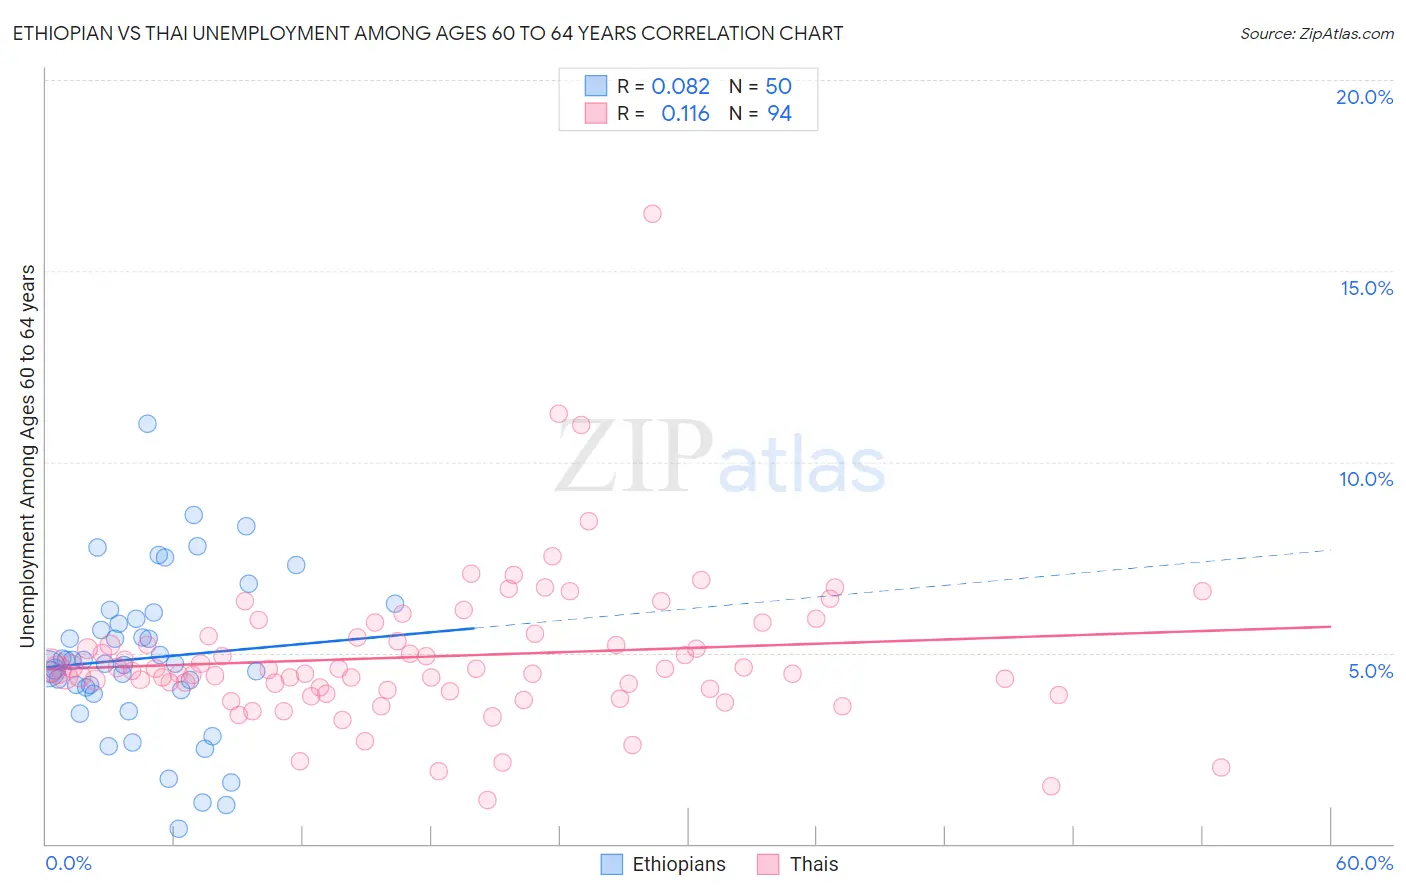
Ethiopian vs Thai Unemployment Among Ages 60 to 64 years Correlation Chart
The statistical analysis conducted on geographies consisting of 210,744,876 people shows a slight positive correlation between the proportion of Ethiopians and unemployment rate among population between the ages 60 and 64 in the United States with a correlation coefficient (R) of 0.082 and weighted average of 4.7%. Similarly, the statistical analysis conducted on geographies consisting of 420,414,129 people shows a poor positive correlation between the proportion of Thais and unemployment rate among population between the ages 60 and 64 in the United States with a correlation coefficient (R) of 0.116 and weighted average of 4.7%, a difference of 0.87%.
Unemployment Among Ages 60 to 64 years Correlation Summary
| Measurement | Ethiopian | Thai |
| Minimum | 0.40% | 1.1% |
| Maximum | 11.0% | 16.5% |
| Range | 10.6% | 15.4% |
| Mean | 4.9% | 4.9% |
| Median | 4.7% | 4.6% |
| Interquartile 25% (IQ1) | 4.0% | 4.0% |
| Interquartile 75% (IQ3) | 5.9% | 5.4% |
| Interquartile Range (IQR) | 1.9% | 1.4% |
| Standard Deviation (Sample) | 2.1% | 2.0% |
| Standard Deviation (Population) | 2.1% | 2.0% |
Similar Demographics by Unemployment Among Ages 60 to 64 years
Demographics Similar to Ethiopians by Unemployment Among Ages 60 to 64 years
In terms of unemployment among ages 60 to 64 years, the demographic groups most similar to Ethiopians are French (4.7%, a difference of 0.060%), Immigrants from Japan (4.7%, a difference of 0.070%), Immigrants from Netherlands (4.7%, a difference of 0.070%), Syrian (4.7%, a difference of 0.090%), and Greek (4.7%, a difference of 0.11%).
| Demographics | Rating | Rank | Unemployment Among Ages 60 to 64 years |
| Whites/Caucasians | 97.8 /100 | #103 | Exceptional 4.7% |
| Paraguayans | 97.7 /100 | #104 | Exceptional 4.7% |
| Canadians | 97.7 /100 | #105 | Exceptional 4.7% |
| Immigrants | North America | 97.6 /100 | #106 | Exceptional 4.7% |
| Greeks | 97.5 /100 | #107 | Exceptional 4.7% |
| Immigrants | Japan | 97.4 /100 | #108 | Exceptional 4.7% |
| Immigrants | Netherlands | 97.4 /100 | #109 | Exceptional 4.7% |
| Ethiopians | 97.2 /100 | #110 | Exceptional 4.7% |
| French | 97.1 /100 | #111 | Exceptional 4.7% |
| Syrians | 97.0 /100 | #112 | Exceptional 4.7% |
| Bulgarians | 96.6 /100 | #113 | Exceptional 4.7% |
| Maltese | 96.5 /100 | #114 | Exceptional 4.7% |
| Immigrants | Romania | 96.4 /100 | #115 | Exceptional 4.7% |
| Immigrants | England | 96.3 /100 | #116 | Exceptional 4.7% |
| Immigrants | Germany | 96.3 /100 | #117 | Exceptional 4.7% |
Demographics Similar to Thais by Unemployment Among Ages 60 to 64 years
In terms of unemployment among ages 60 to 64 years, the demographic groups most similar to Thais are Immigrants from Sri Lanka (4.7%, a difference of 0.0%), Immigrants from Oceania (4.7%, a difference of 0.020%), Immigrants from Jordan (4.7%, a difference of 0.060%), Immigrants from Bulgaria (4.7%, a difference of 0.13%), and Immigrants from Northern Africa (4.7%, a difference of 0.13%).
| Demographics | Rating | Rank | Unemployment Among Ages 60 to 64 years |
| Immigrants | Somalia | 99.2 /100 | #77 | Exceptional 4.6% |
| Seminole | 99.2 /100 | #78 | Exceptional 4.7% |
| Irish | 99.2 /100 | #79 | Exceptional 4.7% |
| Icelanders | 99.1 /100 | #80 | Exceptional 4.7% |
| Iroquois | 99.1 /100 | #81 | Exceptional 4.7% |
| Okinawans | 99.1 /100 | #82 | Exceptional 4.7% |
| Immigrants | Egypt | 99.1 /100 | #83 | Exceptional 4.7% |
| Thais | 98.9 /100 | #84 | Exceptional 4.7% |
| Immigrants | Sri Lanka | 98.9 /100 | #85 | Exceptional 4.7% |
| Immigrants | Oceania | 98.9 /100 | #86 | Exceptional 4.7% |
| Immigrants | Jordan | 98.8 /100 | #87 | Exceptional 4.7% |
| Immigrants | Bulgaria | 98.7 /100 | #88 | Exceptional 4.7% |
| Immigrants | Northern Africa | 98.7 /100 | #89 | Exceptional 4.7% |
| Immigrants | Liberia | 98.7 /100 | #90 | Exceptional 4.7% |
| Immigrants | Uganda | 98.4 /100 | #91 | Exceptional 4.7% |