Immigrants from Senegal vs Immigrants from Czechoslovakia Married-couple Households
COMPARE
Immigrants from Senegal
Immigrants from Czechoslovakia
Married-couple Households
Married-couple Households Comparison
Immigrants from Senegal
Immigrants from Czechoslovakia
38.4%
MARRIED-COUPLE HOUSEHOLDS
0.0/ 100
METRIC RATING
338th/ 347
METRIC RANK
47.8%
MARRIED-COUPLE HOUSEHOLDS
95.5/ 100
METRIC RATING
105th/ 347
METRIC RANK
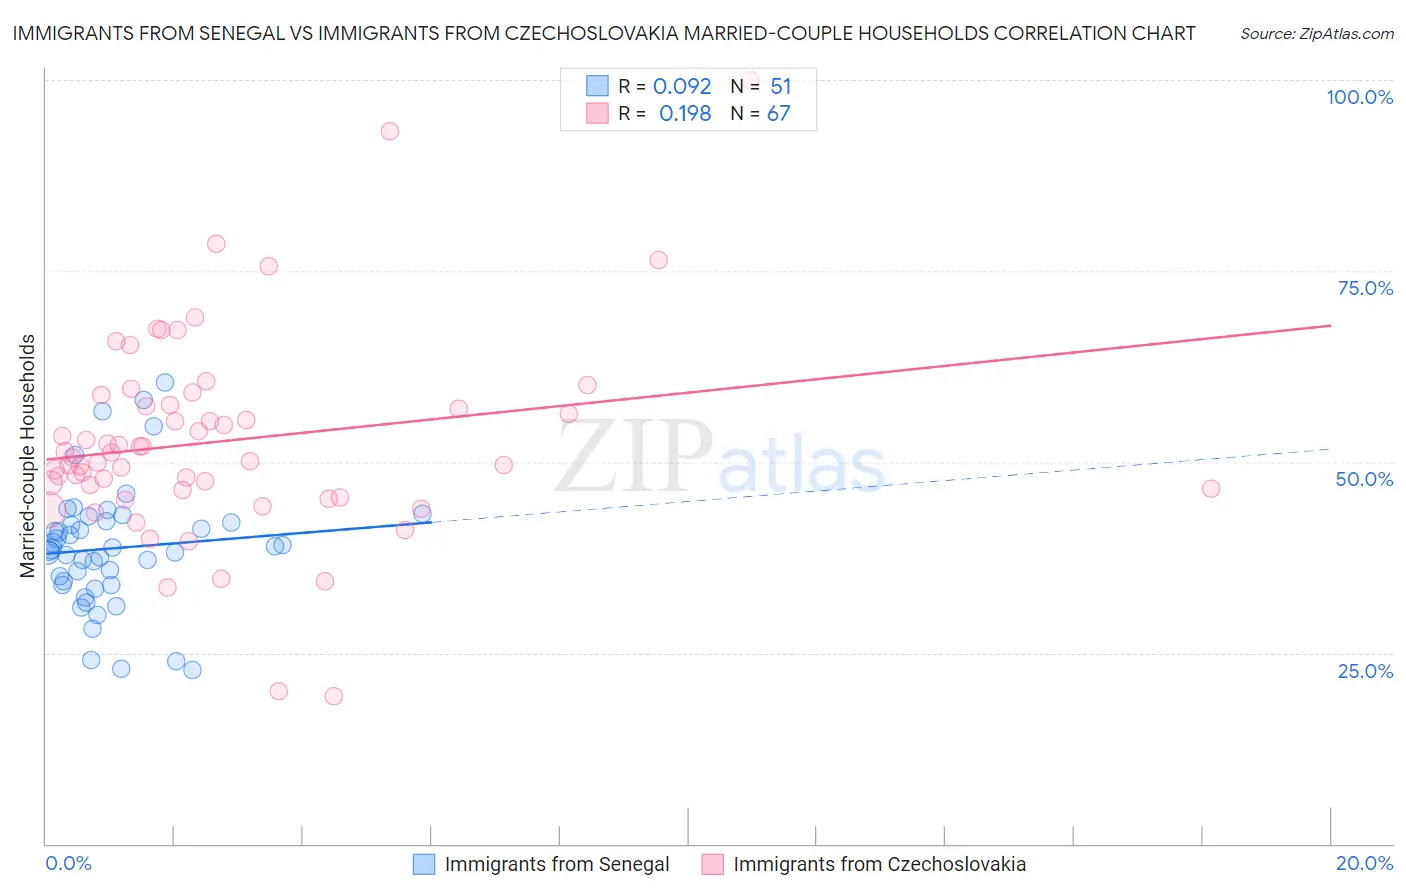
Immigrants from Senegal vs Immigrants from Czechoslovakia Married-couple Households Correlation Chart
The statistical analysis conducted on geographies consisting of 90,124,695 people shows a slight positive correlation between the proportion of Immigrants from Senegal and percentage of married-couple family households in the United States with a correlation coefficient (R) of 0.092 and weighted average of 38.4%. Similarly, the statistical analysis conducted on geographies consisting of 195,446,712 people shows a poor positive correlation between the proportion of Immigrants from Czechoslovakia and percentage of married-couple family households in the United States with a correlation coefficient (R) of 0.198 and weighted average of 47.8%, a difference of 24.5%.
Married-couple Households Correlation Summary
| Measurement | Immigrants from Senegal | Immigrants from Czechoslovakia |
| Minimum | 22.8% | 19.3% |
| Maximum | 60.5% | 100.0% |
| Range | 37.7% | 80.7% |
| Mean | 38.7% | 52.7% |
| Median | 38.6% | 50.6% |
| Interquartile 25% (IQ1) | 33.9% | 46.3% |
| Interquartile 75% (IQ3) | 42.2% | 57.4% |
| Interquartile Range (IQR) | 8.2% | 11.1% |
| Standard Deviation (Sample) | 8.1% | 13.4% |
| Standard Deviation (Population) | 8.0% | 13.3% |
Similar Demographics by Married-couple Households
Demographics Similar to Immigrants from Senegal by Married-couple Households
In terms of married-couple households, the demographic groups most similar to Immigrants from Senegal are British West Indian (38.3%, a difference of 0.13%), Immigrants from Somalia (38.4%, a difference of 0.16%), Black/African American (38.5%, a difference of 0.30%), Senegalese (38.6%, a difference of 0.48%), and Dominican (38.2%, a difference of 0.50%).
| Demographics | Rating | Rank | Married-couple Households |
| Immigrants | Congo | 0.0 /100 | #331 | Tragic 39.0% |
| Somalis | 0.0 /100 | #332 | Tragic 39.0% |
| Immigrants | West Indies | 0.0 /100 | #333 | Tragic 39.0% |
| Immigrants | St. Vincent and the Grenadines | 0.0 /100 | #334 | Tragic 38.7% |
| Senegalese | 0.0 /100 | #335 | Tragic 38.6% |
| Blacks/African Americans | 0.0 /100 | #336 | Tragic 38.5% |
| Immigrants | Somalia | 0.0 /100 | #337 | Tragic 38.4% |
| Immigrants | Senegal | 0.0 /100 | #338 | Tragic 38.4% |
| British West Indians | 0.0 /100 | #339 | Tragic 38.3% |
| Dominicans | 0.0 /100 | #340 | Tragic 38.2% |
| Cape Verdeans | 0.0 /100 | #341 | Tragic 38.1% |
| Tohono O'odham | 0.0 /100 | #342 | Tragic 37.9% |
| Immigrants | Grenada | 0.0 /100 | #343 | Tragic 37.5% |
| Immigrants | Dominican Republic | 0.0 /100 | #344 | Tragic 37.3% |
| Hopi | 0.0 /100 | #345 | Tragic 36.7% |
Demographics Similar to Immigrants from Czechoslovakia by Married-couple Households
In terms of married-couple households, the demographic groups most similar to Immigrants from Czechoslovakia are Portuguese (47.8%, a difference of 0.010%), Immigrants from South Africa (47.8%, a difference of 0.10%), Slavic (47.8%, a difference of 0.11%), Hawaiian (47.8%, a difference of 0.11%), and Turkish (47.8%, a difference of 0.13%).
| Demographics | Rating | Rank | Married-couple Households |
| Immigrants | North Macedonia | 96.4 /100 | #98 | Exceptional 47.9% |
| Immigrants | Austria | 96.4 /100 | #99 | Exceptional 47.9% |
| Immigrants | Italy | 96.3 /100 | #100 | Exceptional 47.9% |
| Turks | 96.1 /100 | #101 | Exceptional 47.8% |
| Slavs | 96.0 /100 | #102 | Exceptional 47.8% |
| Hawaiians | 96.0 /100 | #103 | Exceptional 47.8% |
| Immigrants | South Africa | 96.0 /100 | #104 | Exceptional 47.8% |
| Immigrants | Czechoslovakia | 95.5 /100 | #105 | Exceptional 47.8% |
| Portuguese | 95.5 /100 | #106 | Exceptional 47.8% |
| Estonians | 94.7 /100 | #107 | Exceptional 47.7% |
| Immigrants | Japan | 94.4 /100 | #108 | Exceptional 47.7% |
| Immigrants | Jordan | 94.1 /100 | #109 | Exceptional 47.7% |
| Macedonians | 93.9 /100 | #110 | Exceptional 47.6% |
| Syrians | 93.9 /100 | #111 | Exceptional 47.6% |
| Peruvians | 93.8 /100 | #112 | Exceptional 47.6% |