Ethiopian vs Immigrants from Canada Single Mother Households
COMPARE
Ethiopian
Immigrants from Canada
Single Mother Households
Single Mother Households Comparison
Ethiopians
Immigrants from Canada
6.5%
SINGLE MOTHER HOUSEHOLDS
26.0/ 100
METRIC RATING
184th/ 347
METRIC RANK
5.6%
SINGLE MOTHER HOUSEHOLDS
98.5/ 100
METRIC RATING
66th/ 347
METRIC RANK
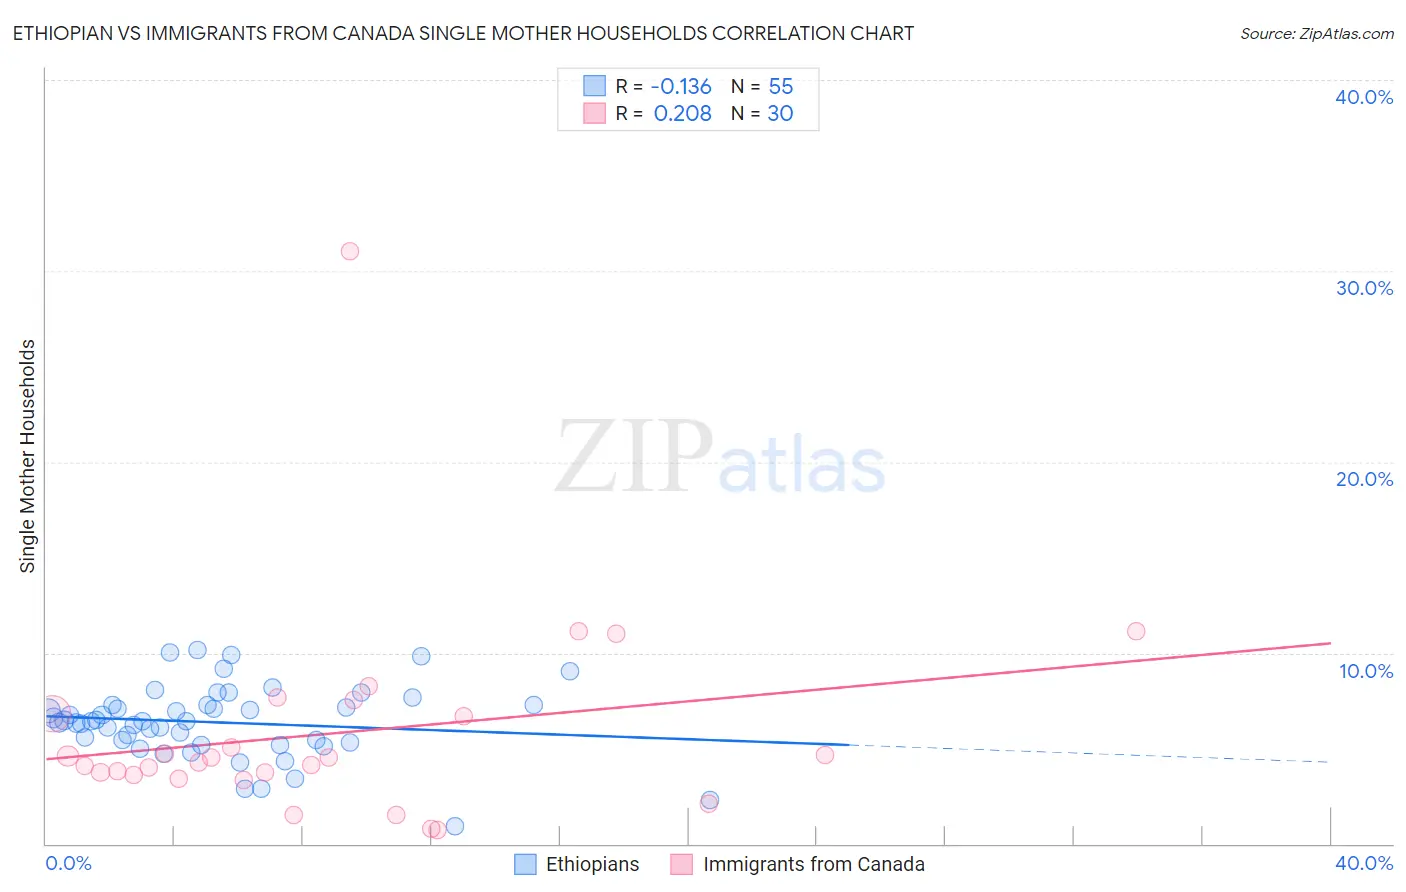
Ethiopian vs Immigrants from Canada Single Mother Households Correlation Chart
The statistical analysis conducted on geographies consisting of 222,859,722 people shows a poor negative correlation between the proportion of Ethiopians and percentage of single mother households in the United States with a correlation coefficient (R) of -0.136 and weighted average of 6.5%. Similarly, the statistical analysis conducted on geographies consisting of 457,332,787 people shows a weak positive correlation between the proportion of Immigrants from Canada and percentage of single mother households in the United States with a correlation coefficient (R) of 0.208 and weighted average of 5.6%, a difference of 16.2%.
Single Mother Households Correlation Summary
| Measurement | Ethiopian | Immigrants from Canada |
| Minimum | 0.92% | 0.70% |
| Maximum | 10.1% | 31.0% |
| Range | 9.2% | 30.3% |
| Mean | 6.4% | 5.8% |
| Median | 6.4% | 4.4% |
| Interquartile 25% (IQ1) | 5.3% | 3.6% |
| Interquartile 75% (IQ3) | 7.3% | 6.8% |
| Interquartile Range (IQR) | 2.0% | 3.2% |
| Standard Deviation (Sample) | 1.9% | 5.5% |
| Standard Deviation (Population) | 1.9% | 5.4% |
Similar Demographics by Single Mother Households
Demographics Similar to Ethiopians by Single Mother Households
In terms of single mother households, the demographic groups most similar to Ethiopians are Ugandan (6.5%, a difference of 0.060%), Costa Rican (6.5%, a difference of 0.17%), Immigrants from Afghanistan (6.5%, a difference of 0.19%), Spaniard (6.5%, a difference of 0.24%), and Ottawa (6.5%, a difference of 0.32%).
| Demographics | Rating | Rank | Single Mother Households |
| Osage | 43.0 /100 | #177 | Average 6.4% |
| Portuguese | 40.0 /100 | #178 | Fair 6.4% |
| Hmong | 39.8 /100 | #179 | Fair 6.4% |
| Immigrants | Nepal | 36.1 /100 | #180 | Fair 6.4% |
| Spanish | 33.4 /100 | #181 | Fair 6.4% |
| South American Indians | 33.4 /100 | #182 | Fair 6.4% |
| Spaniards | 27.8 /100 | #183 | Fair 6.5% |
| Ethiopians | 26.0 /100 | #184 | Fair 6.5% |
| Ugandans | 25.6 /100 | #185 | Fair 6.5% |
| Costa Ricans | 24.8 /100 | #186 | Fair 6.5% |
| Immigrants | Afghanistan | 24.7 /100 | #187 | Fair 6.5% |
| Ottawa | 23.8 /100 | #188 | Fair 6.5% |
| Delaware | 23.3 /100 | #189 | Fair 6.5% |
| Peruvians | 21.6 /100 | #190 | Fair 6.5% |
| Samoans | 21.2 /100 | #191 | Fair 6.5% |
Demographics Similar to Immigrants from Canada by Single Mother Households
In terms of single mother households, the demographic groups most similar to Immigrants from Canada are Italian (5.6%, a difference of 0.020%), Immigrants from Bulgaria (5.6%, a difference of 0.080%), Greek (5.6%, a difference of 0.10%), Asian (5.6%, a difference of 0.11%), and Immigrants from France (5.6%, a difference of 0.15%).
| Demographics | Rating | Rank | Single Mother Households |
| Luxembourgers | 98.7 /100 | #59 | Exceptional 5.6% |
| Immigrants | Norway | 98.7 /100 | #60 | Exceptional 5.6% |
| Australians | 98.7 /100 | #61 | Exceptional 5.6% |
| Poles | 98.6 /100 | #62 | Exceptional 5.6% |
| Immigrants | North Macedonia | 98.6 /100 | #63 | Exceptional 5.6% |
| Immigrants | France | 98.6 /100 | #64 | Exceptional 5.6% |
| Greeks | 98.6 /100 | #65 | Exceptional 5.6% |
| Immigrants | Canada | 98.5 /100 | #66 | Exceptional 5.6% |
| Italians | 98.5 /100 | #67 | Exceptional 5.6% |
| Immigrants | Bulgaria | 98.5 /100 | #68 | Exceptional 5.6% |
| Asians | 98.5 /100 | #69 | Exceptional 5.6% |
| Immigrants | Eastern Europe | 98.4 /100 | #70 | Exceptional 5.6% |
| Immigrants | Kazakhstan | 98.4 /100 | #71 | Exceptional 5.6% |
| Immigrants | Netherlands | 98.4 /100 | #72 | Exceptional 5.6% |
| Immigrants | Asia | 98.4 /100 | #73 | Exceptional 5.6% |