Ethiopian vs Bhutanese 4th Grade
COMPARE
Ethiopian
Bhutanese
4th Grade
4th Grade Comparison
Ethiopians
Bhutanese
97.1%
4TH GRADE
1.2/ 100
METRIC RATING
247th/ 347
METRIC RANK
97.9%
4TH GRADE
97.4/ 100
METRIC RATING
107th/ 347
METRIC RANK
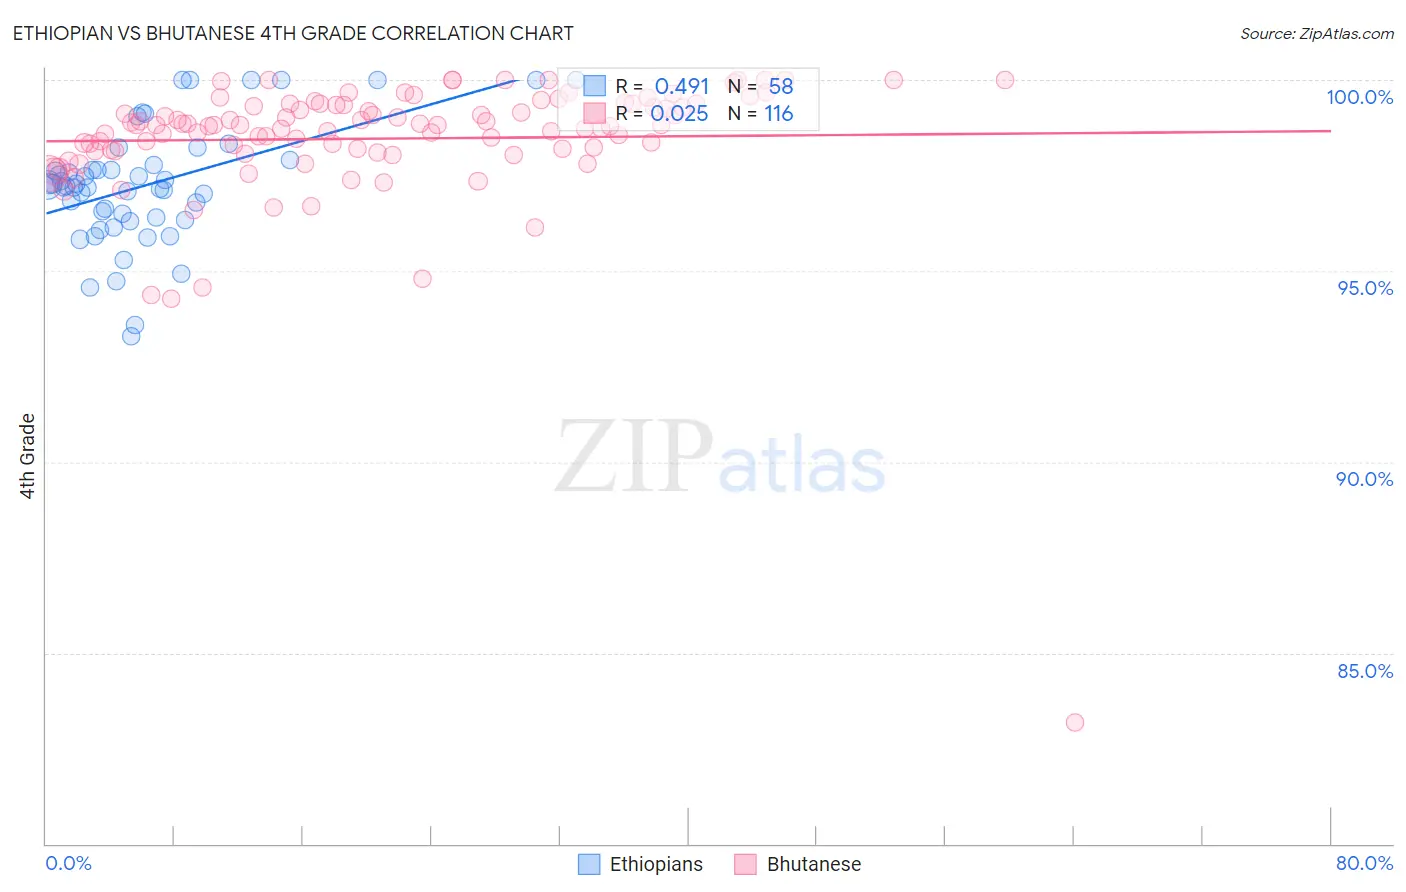
Ethiopian vs Bhutanese 4th Grade Correlation Chart
The statistical analysis conducted on geographies consisting of 223,120,541 people shows a moderate positive correlation between the proportion of Ethiopians and percentage of population with at least 4th grade education in the United States with a correlation coefficient (R) of 0.491 and weighted average of 97.1%. Similarly, the statistical analysis conducted on geographies consisting of 455,591,134 people shows no correlation between the proportion of Bhutanese and percentage of population with at least 4th grade education in the United States with a correlation coefficient (R) of 0.025 and weighted average of 97.9%, a difference of 0.76%.
4th Grade Correlation Summary
| Measurement | Ethiopian | Bhutanese |
| Minimum | 93.3% | 83.2% |
| Maximum | 100.0% | 100.0% |
| Range | 6.7% | 16.8% |
| Mean | 97.3% | 98.5% |
| Median | 97.2% | 98.8% |
| Interquartile 25% (IQ1) | 96.4% | 98.2% |
| Interquartile 75% (IQ3) | 97.8% | 99.4% |
| Interquartile Range (IQR) | 1.3% | 1.2% |
| Standard Deviation (Sample) | 1.5% | 1.8% |
| Standard Deviation (Population) | 1.5% | 1.8% |
Similar Demographics by 4th Grade
Demographics Similar to Ethiopians by 4th Grade
In terms of 4th grade, the demographic groups most similar to Ethiopians are Korean (97.1%, a difference of 0.0%), Immigrants from Eastern Africa (97.1%, a difference of 0.0%), Immigrants from Uruguay (97.1%, a difference of 0.0%), Immigrants from Asia (97.1%, a difference of 0.0%), and Asian (97.1%, a difference of 0.010%).
| Demographics | Rating | Rank | 4th Grade |
| Colombians | 1.6 /100 | #240 | Tragic 97.1% |
| Immigrants | Indonesia | 1.5 /100 | #241 | Tragic 97.1% |
| Asians | 1.4 /100 | #242 | Tragic 97.1% |
| U.S. Virgin Islanders | 1.4 /100 | #243 | Tragic 97.1% |
| Koreans | 1.3 /100 | #244 | Tragic 97.1% |
| Immigrants | Eastern Africa | 1.2 /100 | #245 | Tragic 97.1% |
| Immigrants | Uruguay | 1.2 /100 | #246 | Tragic 97.1% |
| Ethiopians | 1.2 /100 | #247 | Tragic 97.1% |
| Immigrants | Asia | 1.2 /100 | #248 | Tragic 97.1% |
| Immigrants | Africa | 1.0 /100 | #249 | Tragic 97.1% |
| Immigrants | Senegal | 0.9 /100 | #250 | Tragic 97.1% |
| South Americans | 0.8 /100 | #251 | Tragic 97.1% |
| Jamaicans | 0.8 /100 | #252 | Tragic 97.1% |
| Immigrants | Liberia | 0.8 /100 | #253 | Tragic 97.1% |
| Immigrants | Middle Africa | 0.8 /100 | #254 | Tragic 97.1% |
Demographics Similar to Bhutanese by 4th Grade
In terms of 4th grade, the demographic groups most similar to Bhutanese are Immigrants from Czechoslovakia (97.9%, a difference of 0.0%), Immigrants from Singapore (97.9%, a difference of 0.0%), Puget Sound Salish (97.9%, a difference of 0.010%), Nonimmigrants (97.9%, a difference of 0.010%), and German Russian (97.9%, a difference of 0.010%).
| Demographics | Rating | Rank | 4th Grade |
| Yugoslavians | 98.1 /100 | #100 | Exceptional 97.9% |
| Cree | 98.1 /100 | #101 | Exceptional 97.9% |
| Choctaw | 97.9 /100 | #102 | Exceptional 97.9% |
| Puget Sound Salish | 97.7 /100 | #103 | Exceptional 97.9% |
| Immigrants | Nonimmigrants | 97.5 /100 | #104 | Exceptional 97.9% |
| German Russians | 97.5 /100 | #105 | Exceptional 97.9% |
| Immigrants | Czechoslovakia | 97.5 /100 | #106 | Exceptional 97.9% |
| Bhutanese | 97.4 /100 | #107 | Exceptional 97.9% |
| Immigrants | Singapore | 97.3 /100 | #108 | Exceptional 97.9% |
| Immigrants | Latvia | 96.8 /100 | #109 | Exceptional 97.8% |
| Thais | 96.7 /100 | #110 | Exceptional 97.8% |
| Immigrants | Switzerland | 96.1 /100 | #111 | Exceptional 97.8% |
| Okinawans | 96.0 /100 | #112 | Exceptional 97.8% |
| Basques | 95.8 /100 | #113 | Exceptional 97.8% |
| Iroquois | 95.4 /100 | #114 | Exceptional 97.8% |