Ethiopian vs Scotch-Irish Family Households with Children
COMPARE
Ethiopian
Scotch-Irish
Family Households with Children
Family Households with Children Comparison
Ethiopians
Scotch-Irish
27.6%
FAMILY HOUSEHOLDS WITH CHILDREN
77.0/ 100
METRIC RATING
152nd/ 347
METRIC RANK
26.8%
FAMILY HOUSEHOLDS WITH CHILDREN
1.4/ 100
METRIC RATING
256th/ 347
METRIC RANK
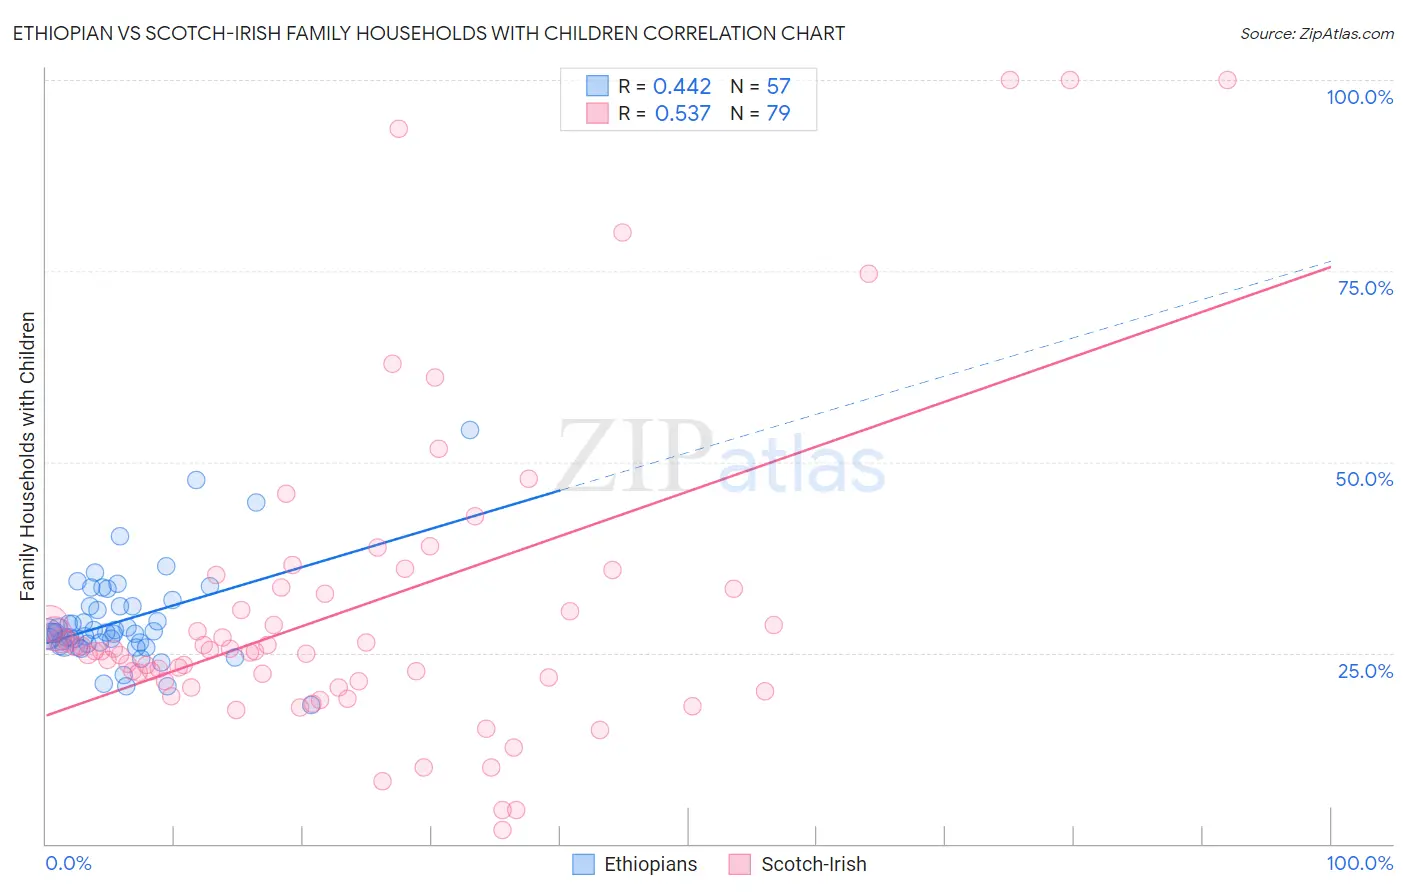
Ethiopian vs Scotch-Irish Family Households with Children Correlation Chart
The statistical analysis conducted on geographies consisting of 223,037,255 people shows a moderate positive correlation between the proportion of Ethiopians and percentage of family households with children in the United States with a correlation coefficient (R) of 0.442 and weighted average of 27.6%. Similarly, the statistical analysis conducted on geographies consisting of 548,065,437 people shows a substantial positive correlation between the proportion of Scotch-Irish and percentage of family households with children in the United States with a correlation coefficient (R) of 0.537 and weighted average of 26.8%, a difference of 3.1%.
Family Households with Children Correlation Summary
| Measurement | Ethiopian | Scotch-Irish |
| Minimum | 18.2% | 1.9% |
| Maximum | 54.1% | 100.0% |
| Range | 35.9% | 98.1% |
| Mean | 29.2% | 30.8% |
| Median | 27.6% | 25.3% |
| Interquartile 25% (IQ1) | 26.0% | 21.2% |
| Interquartile 75% (IQ3) | 31.2% | 33.3% |
| Interquartile Range (IQR) | 5.1% | 12.1% |
| Standard Deviation (Sample) | 6.2% | 20.6% |
| Standard Deviation (Population) | 6.2% | 20.5% |
Similar Demographics by Family Households with Children
Demographics Similar to Ethiopians by Family Households with Children
In terms of family households with children, the demographic groups most similar to Ethiopians are Portuguese (27.6%, a difference of 0.030%), Immigrants from Cabo Verde (27.6%, a difference of 0.040%), Argentinean (27.6%, a difference of 0.050%), Icelander (27.6%, a difference of 0.050%), and Osage (27.6%, a difference of 0.060%).
| Demographics | Rating | Rank | Family Households with Children |
| Immigrants | Chile | 79.5 /100 | #145 | Good 27.7% |
| Basques | 79.5 /100 | #146 | Good 27.7% |
| Immigrants | Moldova | 79.1 /100 | #147 | Good 27.6% |
| Osage | 79.0 /100 | #148 | Good 27.6% |
| Menominee | 78.9 /100 | #149 | Good 27.6% |
| Argentineans | 78.5 /100 | #150 | Good 27.6% |
| Portuguese | 77.8 /100 | #151 | Good 27.6% |
| Ethiopians | 77.0 /100 | #152 | Good 27.6% |
| Immigrants | Cabo Verde | 75.6 /100 | #153 | Good 27.6% |
| Icelanders | 75.3 /100 | #154 | Good 27.6% |
| Comanche | 74.8 /100 | #155 | Good 27.6% |
| Hungarians | 74.6 /100 | #156 | Good 27.6% |
| Indians (Asian) | 71.6 /100 | #157 | Good 27.6% |
| Romanians | 70.8 /100 | #158 | Good 27.6% |
| Mongolians | 70.7 /100 | #159 | Good 27.6% |
Demographics Similar to Scotch-Irish by Family Households with Children
In terms of family households with children, the demographic groups most similar to Scotch-Irish are German Russian (26.8%, a difference of 0.010%), Immigrants from Scotland (26.8%, a difference of 0.020%), Italian (26.8%, a difference of 0.050%), Slavic (26.8%, a difference of 0.050%), and Immigrants from Cuba (26.8%, a difference of 0.050%).
| Demographics | Rating | Rank | Family Households with Children |
| Immigrants | Eastern Europe | 2.1 /100 | #249 | Tragic 26.9% |
| Belgians | 2.1 /100 | #250 | Tragic 26.9% |
| Immigrants | Bosnia and Herzegovina | 1.9 /100 | #251 | Tragic 26.8% |
| Irish | 1.8 /100 | #252 | Tragic 26.8% |
| Italians | 1.5 /100 | #253 | Tragic 26.8% |
| Immigrants | Scotland | 1.5 /100 | #254 | Tragic 26.8% |
| German Russians | 1.5 /100 | #255 | Tragic 26.8% |
| Scotch-Irish | 1.4 /100 | #256 | Tragic 26.8% |
| Slavs | 1.3 /100 | #257 | Tragic 26.8% |
| Immigrants | Cuba | 1.3 /100 | #258 | Tragic 26.8% |
| Immigrants | Lithuania | 1.2 /100 | #259 | Tragic 26.8% |
| Immigrants | Jamaica | 1.2 /100 | #260 | Tragic 26.8% |
| Immigrants | Belarus | 1.1 /100 | #261 | Tragic 26.8% |
| Immigrants | Russia | 1.0 /100 | #262 | Tragic 26.8% |
| Immigrants | North Macedonia | 1.0 /100 | #263 | Tragic 26.7% |