Ethiopian vs Trinidadian and Tobagonian Family Households with Children
COMPARE
Ethiopian
Trinidadian and Tobagonian
Family Households with Children
Family Households with Children Comparison
Ethiopians
Trinidadians and Tobagonians
27.6%
FAMILY HOUSEHOLDS WITH CHILDREN
77.0/ 100
METRIC RATING
152nd/ 347
METRIC RANK
26.4%
FAMILY HOUSEHOLDS WITH CHILDREN
0.1/ 100
METRIC RATING
299th/ 347
METRIC RANK
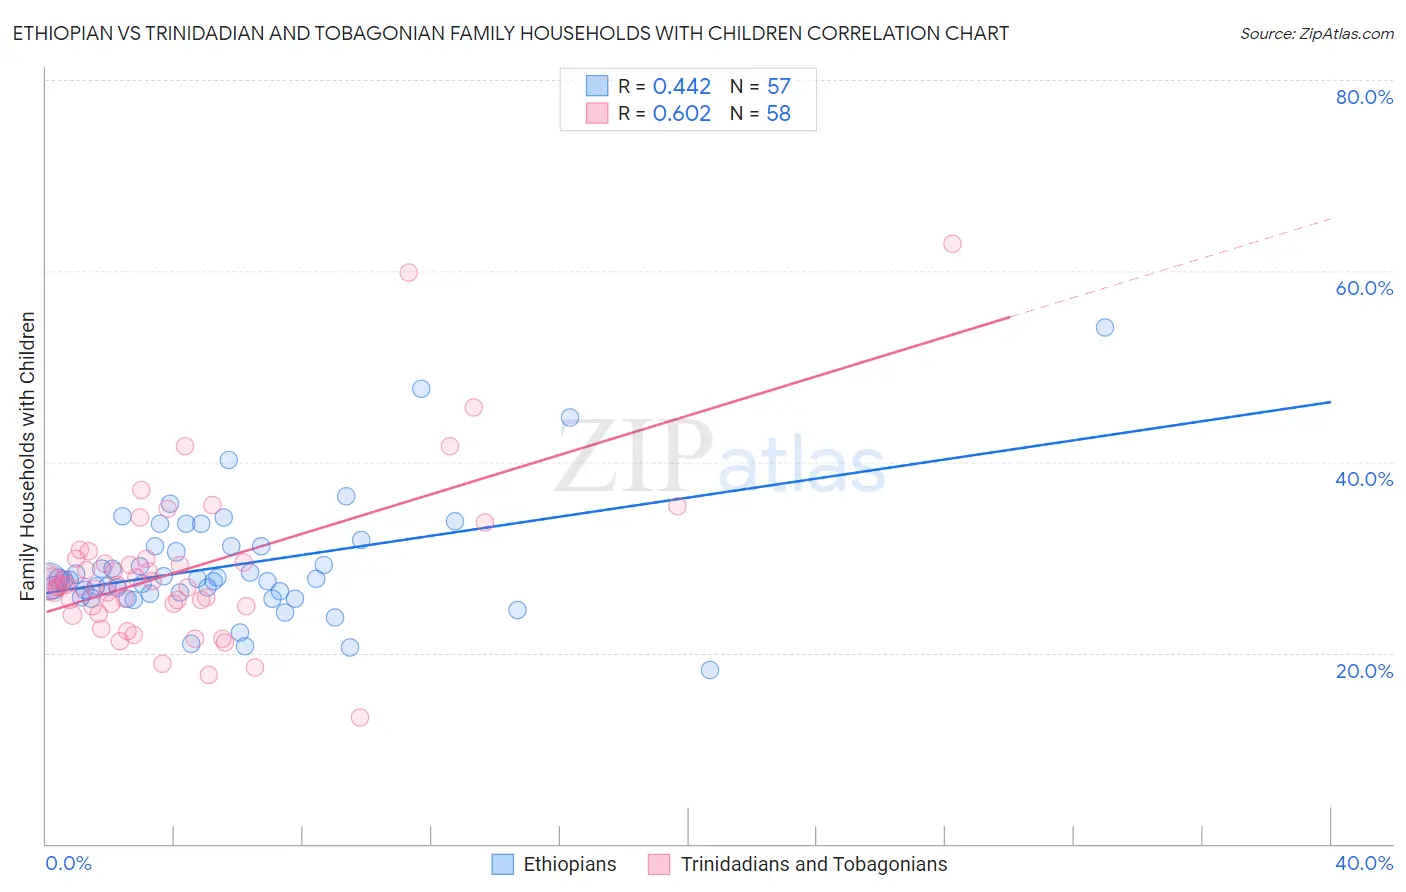
Ethiopian vs Trinidadian and Tobagonian Family Households with Children Correlation Chart
The statistical analysis conducted on geographies consisting of 223,037,255 people shows a moderate positive correlation between the proportion of Ethiopians and percentage of family households with children in the United States with a correlation coefficient (R) of 0.442 and weighted average of 27.6%. Similarly, the statistical analysis conducted on geographies consisting of 219,664,488 people shows a significant positive correlation between the proportion of Trinidadians and Tobagonians and percentage of family households with children in the United States with a correlation coefficient (R) of 0.602 and weighted average of 26.4%, a difference of 4.7%.
Family Households with Children Correlation Summary
| Measurement | Ethiopian | Trinidadian and Tobagonian |
| Minimum | 18.2% | 13.3% |
| Maximum | 54.1% | 62.8% |
| Range | 35.9% | 49.5% |
| Mean | 29.2% | 28.7% |
| Median | 27.6% | 27.1% |
| Interquartile 25% (IQ1) | 26.0% | 24.9% |
| Interquartile 75% (IQ3) | 31.2% | 29.8% |
| Interquartile Range (IQR) | 5.1% | 4.9% |
| Standard Deviation (Sample) | 6.2% | 8.5% |
| Standard Deviation (Population) | 6.2% | 8.4% |
Similar Demographics by Family Households with Children
Demographics Similar to Ethiopians by Family Households with Children
In terms of family households with children, the demographic groups most similar to Ethiopians are Portuguese (27.6%, a difference of 0.030%), Immigrants from Cabo Verde (27.6%, a difference of 0.040%), Argentinean (27.6%, a difference of 0.050%), Icelander (27.6%, a difference of 0.050%), and Osage (27.6%, a difference of 0.060%).
| Demographics | Rating | Rank | Family Households with Children |
| Immigrants | Chile | 79.5 /100 | #145 | Good 27.7% |
| Basques | 79.5 /100 | #146 | Good 27.7% |
| Immigrants | Moldova | 79.1 /100 | #147 | Good 27.6% |
| Osage | 79.0 /100 | #148 | Good 27.6% |
| Menominee | 78.9 /100 | #149 | Good 27.6% |
| Argentineans | 78.5 /100 | #150 | Good 27.6% |
| Portuguese | 77.8 /100 | #151 | Good 27.6% |
| Ethiopians | 77.0 /100 | #152 | Good 27.6% |
| Immigrants | Cabo Verde | 75.6 /100 | #153 | Good 27.6% |
| Icelanders | 75.3 /100 | #154 | Good 27.6% |
| Comanche | 74.8 /100 | #155 | Good 27.6% |
| Hungarians | 74.6 /100 | #156 | Good 27.6% |
| Indians (Asian) | 71.6 /100 | #157 | Good 27.6% |
| Romanians | 70.8 /100 | #158 | Good 27.6% |
| Mongolians | 70.7 /100 | #159 | Good 27.6% |
Demographics Similar to Trinidadians and Tobagonians by Family Households with Children
In terms of family households with children, the demographic groups most similar to Trinidadians and Tobagonians are Immigrants from Western Europe (26.4%, a difference of 0.010%), Armenian (26.4%, a difference of 0.11%), Croatian (26.4%, a difference of 0.12%), Paiute (26.4%, a difference of 0.12%), and Macedonian (26.4%, a difference of 0.14%).
| Demographics | Rating | Rank | Family Households with Children |
| Poles | 0.2 /100 | #292 | Tragic 26.5% |
| Blacks/African Americans | 0.1 /100 | #293 | Tragic 26.5% |
| Latvians | 0.1 /100 | #294 | Tragic 26.4% |
| Macedonians | 0.1 /100 | #295 | Tragic 26.4% |
| Croatians | 0.1 /100 | #296 | Tragic 26.4% |
| Armenians | 0.1 /100 | #297 | Tragic 26.4% |
| Immigrants | Western Europe | 0.1 /100 | #298 | Tragic 26.4% |
| Trinidadians and Tobagonians | 0.1 /100 | #299 | Tragic 26.4% |
| Paiute | 0.1 /100 | #300 | Tragic 26.4% |
| Immigrants | Trinidad and Tobago | 0.1 /100 | #301 | Tragic 26.4% |
| Serbians | 0.1 /100 | #302 | Tragic 26.4% |
| Immigrants | Guyana | 0.1 /100 | #303 | Tragic 26.3% |
| Immigrants | Bahamas | 0.1 /100 | #304 | Tragic 26.3% |
| Guyanese | 0.1 /100 | #305 | Tragic 26.3% |
| Bermudans | 0.1 /100 | #306 | Tragic 26.3% |