Immigrants from Hong Kong vs Apache Family Households with Children
COMPARE
Immigrants from Hong Kong
Apache
Family Households with Children
Family Households with Children Comparison
Immigrants from Hong Kong
Apache
27.5%
FAMILY HOUSEHOLDS WITH CHILDREN
64.9/ 100
METRIC RATING
164th/ 347
METRIC RANK
29.0%
FAMILY HOUSEHOLDS WITH CHILDREN
100.0/ 100
METRIC RATING
48th/ 347
METRIC RANK
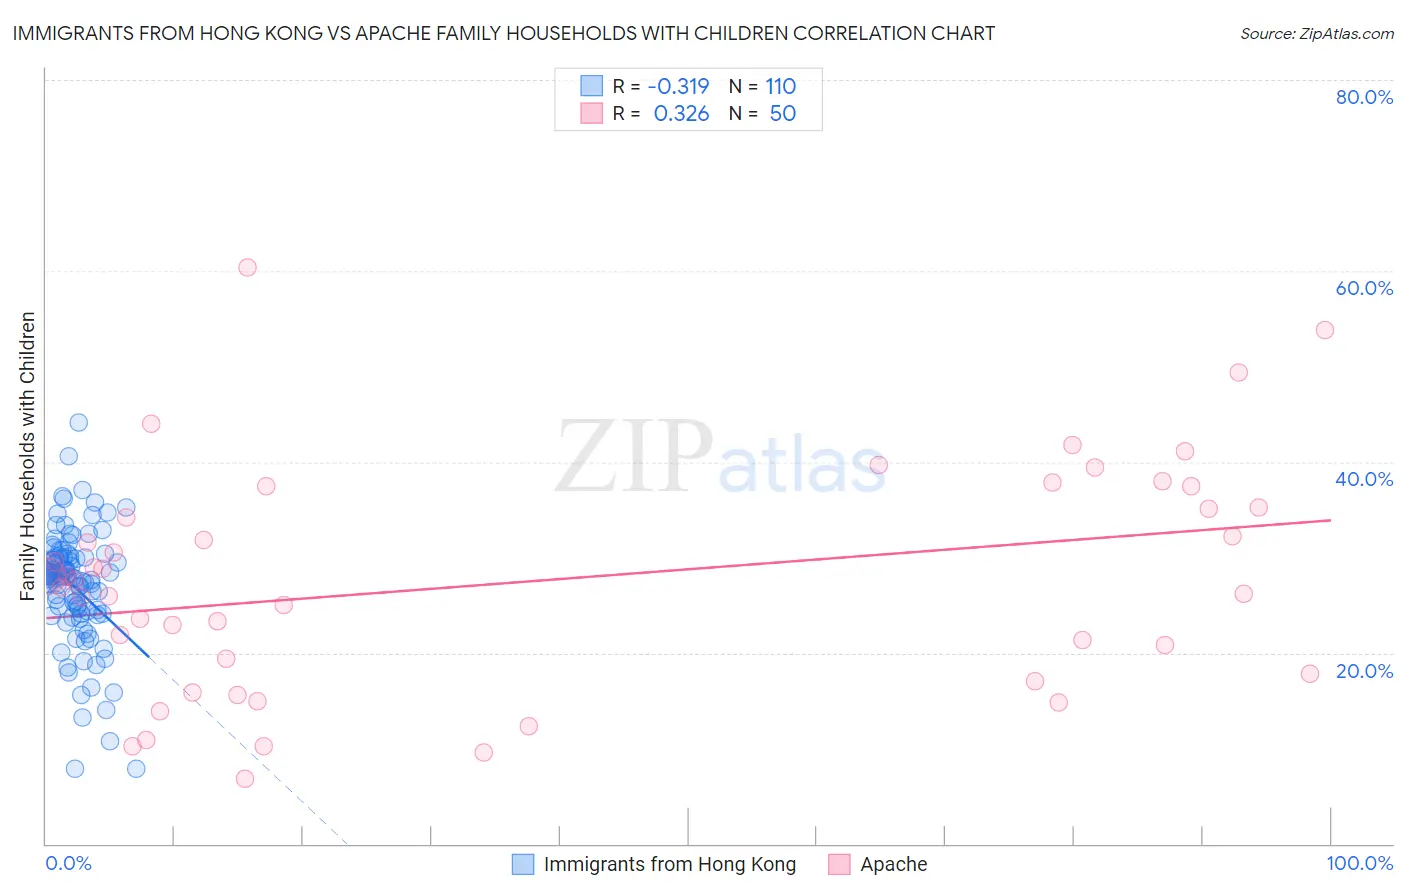
Immigrants from Hong Kong vs Apache Family Households with Children Correlation Chart
The statistical analysis conducted on geographies consisting of 253,815,844 people shows a mild negative correlation between the proportion of Immigrants from Hong Kong and percentage of family households with children in the United States with a correlation coefficient (R) of -0.319 and weighted average of 27.5%. Similarly, the statistical analysis conducted on geographies consisting of 231,023,024 people shows a mild positive correlation between the proportion of Apache and percentage of family households with children in the United States with a correlation coefficient (R) of 0.326 and weighted average of 29.0%, a difference of 5.2%.
Family Households with Children Correlation Summary
| Measurement | Immigrants from Hong Kong | Apache |
| Minimum | 7.8% | 6.8% |
| Maximum | 44.2% | 60.3% |
| Range | 36.3% | 53.6% |
| Mean | 26.9% | 27.5% |
| Median | 28.0% | 27.2% |
| Interquartile 25% (IQ1) | 24.3% | 17.8% |
| Interquartile 75% (IQ3) | 30.0% | 35.2% |
| Interquartile Range (IQR) | 5.6% | 17.4% |
| Standard Deviation (Sample) | 6.0% | 11.9% |
| Standard Deviation (Population) | 6.0% | 11.8% |
Similar Demographics by Family Households with Children
Demographics Similar to Immigrants from Hong Kong by Family Households with Children
In terms of family households with children, the demographic groups most similar to Immigrants from Hong Kong are Czech (27.5%, a difference of 0.010%), Alaskan Athabascan (27.6%, a difference of 0.050%), Immigrants from Bangladesh (27.6%, a difference of 0.050%), Subsaharan African (27.6%, a difference of 0.060%), and Immigrants from South Africa (27.5%, a difference of 0.080%).
| Demographics | Rating | Rank | Family Households with Children |
| Indians (Asian) | 71.6 /100 | #157 | Good 27.6% |
| Romanians | 70.8 /100 | #158 | Good 27.6% |
| Mongolians | 70.7 /100 | #159 | Good 27.6% |
| Sub-Saharan Africans | 67.5 /100 | #160 | Good 27.6% |
| Alaskan Athabascans | 67.1 /100 | #161 | Good 27.6% |
| Immigrants | Bangladesh | 67.0 /100 | #162 | Good 27.6% |
| Czechs | 65.3 /100 | #163 | Good 27.5% |
| Immigrants | Hong Kong | 64.9 /100 | #164 | Good 27.5% |
| Immigrants | South Africa | 61.3 /100 | #165 | Good 27.5% |
| Immigrants | Nonimmigrants | 61.2 /100 | #166 | Good 27.5% |
| Dominicans | 61.1 /100 | #167 | Good 27.5% |
| Immigrants | Kuwait | 60.9 /100 | #168 | Good 27.5% |
| Seminole | 56.9 /100 | #169 | Average 27.5% |
| Cherokee | 56.7 /100 | #170 | Average 27.5% |
| Blackfeet | 54.3 /100 | #171 | Average 27.5% |
Demographics Similar to Apache by Family Households with Children
In terms of family households with children, the demographic groups most similar to Apache are Peruvian (29.0%, a difference of 0.030%), Immigrants from Philippines (29.0%, a difference of 0.040%), Jordanian (29.0%, a difference of 0.090%), Fijian (29.0%, a difference of 0.13%), and Immigrants from Taiwan (29.0%, a difference of 0.18%).
| Demographics | Rating | Rank | Family Households with Children |
| Immigrants | South Eastern Asia | 100.0 /100 | #41 | Exceptional 29.1% |
| Spanish American Indians | 100.0 /100 | #42 | Exceptional 29.1% |
| Asians | 100.0 /100 | #43 | Exceptional 29.1% |
| Immigrants | Taiwan | 100.0 /100 | #44 | Exceptional 29.0% |
| Fijians | 100.0 /100 | #45 | Exceptional 29.0% |
| Immigrants | Philippines | 100.0 /100 | #46 | Exceptional 29.0% |
| Peruvians | 100.0 /100 | #47 | Exceptional 29.0% |
| Apache | 100.0 /100 | #48 | Exceptional 29.0% |
| Jordanians | 100.0 /100 | #49 | Exceptional 29.0% |
| Immigrants | Immigrants | 100.0 /100 | #50 | Exceptional 28.9% |
| Immigrants | Peru | 100.0 /100 | #51 | Exceptional 28.9% |
| Guatemalans | 100.0 /100 | #52 | Exceptional 28.9% |
| Immigrants | Cambodia | 100.0 /100 | #53 | Exceptional 28.9% |
| Sierra Leoneans | 100.0 /100 | #54 | Exceptional 28.9% |
| Immigrants | Asia | 100.0 /100 | #55 | Exceptional 28.8% |