Ethiopian vs Immigrants from West Indies Family Households with Children
COMPARE
Ethiopian
Immigrants from West Indies
Family Households with Children
Family Households with Children Comparison
Ethiopians
Immigrants from West Indies
27.6%
FAMILY HOUSEHOLDS WITH CHILDREN
77.0/ 100
METRIC RATING
152nd/ 347
METRIC RANK
25.7%
FAMILY HOUSEHOLDS WITH CHILDREN
0.0/ 100
METRIC RATING
336th/ 347
METRIC RANK
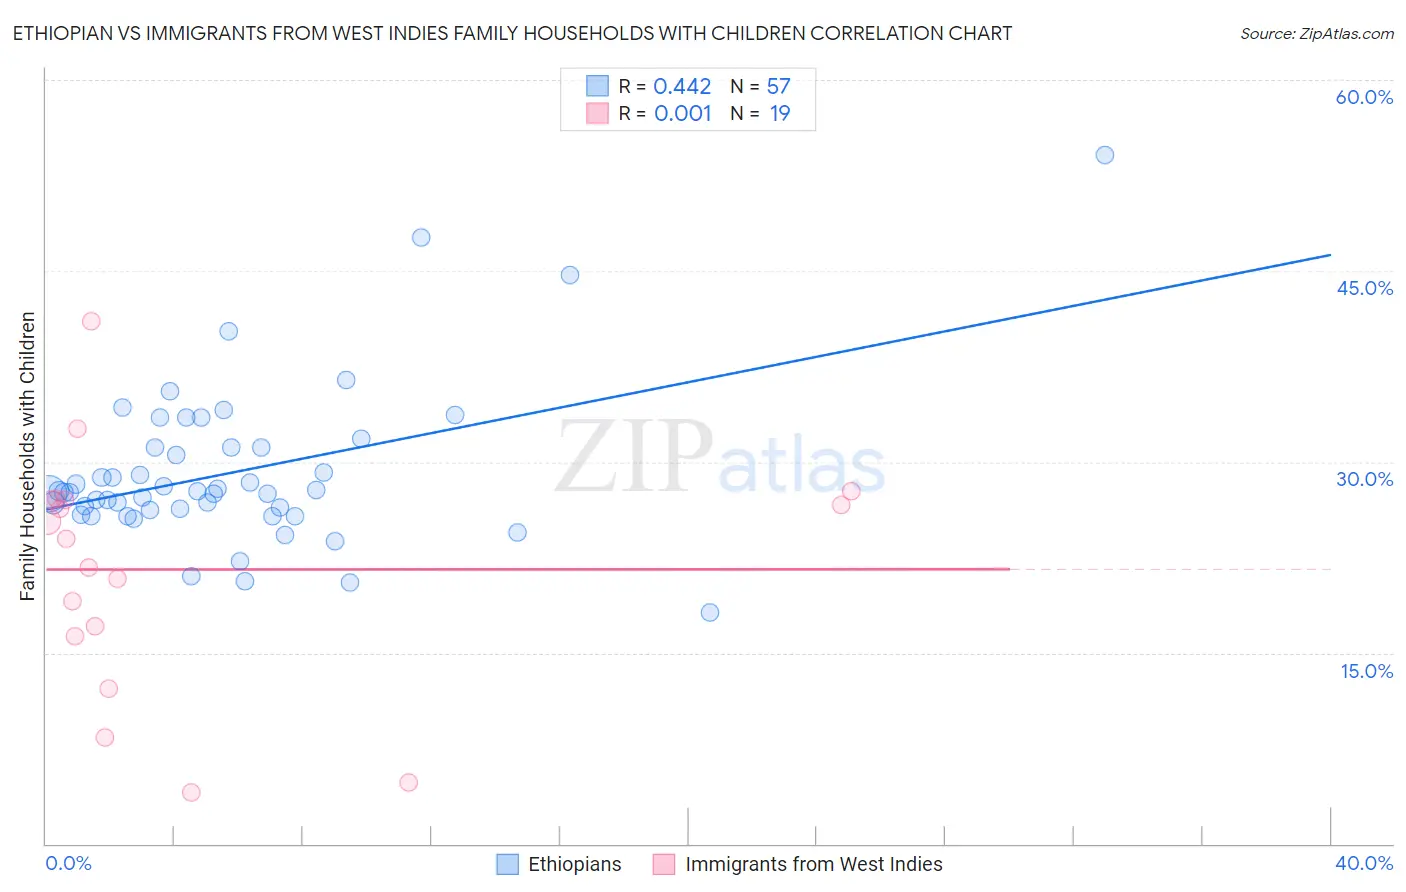
Ethiopian vs Immigrants from West Indies Family Households with Children Correlation Chart
The statistical analysis conducted on geographies consisting of 223,037,255 people shows a moderate positive correlation between the proportion of Ethiopians and percentage of family households with children in the United States with a correlation coefficient (R) of 0.442 and weighted average of 27.6%. Similarly, the statistical analysis conducted on geographies consisting of 72,454,628 people shows no correlation between the proportion of Immigrants from West Indies and percentage of family households with children in the United States with a correlation coefficient (R) of 0.001 and weighted average of 25.7%, a difference of 7.6%.
Family Households with Children Correlation Summary
| Measurement | Ethiopian | Immigrants from West Indies |
| Minimum | 18.2% | 4.1% |
| Maximum | 54.1% | 41.1% |
| Range | 35.9% | 37.0% |
| Mean | 29.2% | 21.5% |
| Median | 27.6% | 24.0% |
| Interquartile 25% (IQ1) | 26.0% | 16.3% |
| Interquartile 75% (IQ3) | 31.2% | 27.0% |
| Interquartile Range (IQR) | 5.1% | 10.8% |
| Standard Deviation (Sample) | 6.2% | 9.4% |
| Standard Deviation (Population) | 6.2% | 9.2% |
Similar Demographics by Family Households with Children
Demographics Similar to Ethiopians by Family Households with Children
In terms of family households with children, the demographic groups most similar to Ethiopians are Portuguese (27.6%, a difference of 0.030%), Immigrants from Cabo Verde (27.6%, a difference of 0.040%), Argentinean (27.6%, a difference of 0.050%), Icelander (27.6%, a difference of 0.050%), and Osage (27.6%, a difference of 0.060%).
| Demographics | Rating | Rank | Family Households with Children |
| Immigrants | Chile | 79.5 /100 | #145 | Good 27.7% |
| Basques | 79.5 /100 | #146 | Good 27.7% |
| Immigrants | Moldova | 79.1 /100 | #147 | Good 27.6% |
| Osage | 79.0 /100 | #148 | Good 27.6% |
| Menominee | 78.9 /100 | #149 | Good 27.6% |
| Argentineans | 78.5 /100 | #150 | Good 27.6% |
| Portuguese | 77.8 /100 | #151 | Good 27.6% |
| Ethiopians | 77.0 /100 | #152 | Good 27.6% |
| Immigrants | Cabo Verde | 75.6 /100 | #153 | Good 27.6% |
| Icelanders | 75.3 /100 | #154 | Good 27.6% |
| Comanche | 74.8 /100 | #155 | Good 27.6% |
| Hungarians | 74.6 /100 | #156 | Good 27.6% |
| Indians (Asian) | 71.6 /100 | #157 | Good 27.6% |
| Romanians | 70.8 /100 | #158 | Good 27.6% |
| Mongolians | 70.7 /100 | #159 | Good 27.6% |
Demographics Similar to Immigrants from West Indies by Family Households with Children
In terms of family households with children, the demographic groups most similar to Immigrants from West Indies are Immigrants from Croatia (25.7%, a difference of 0.10%), Slovak (25.7%, a difference of 0.11%), Immigrants from Switzerland (25.7%, a difference of 0.26%), Immigrants from Austria (25.8%, a difference of 0.34%), and Puerto Rican (25.6%, a difference of 0.39%).
| Demographics | Rating | Rank | Family Households with Children |
| Cypriots | 0.0 /100 | #329 | Tragic 25.9% |
| Immigrants | Latvia | 0.0 /100 | #330 | Tragic 25.9% |
| Slovenes | 0.0 /100 | #331 | Tragic 25.8% |
| Immigrants | Austria | 0.0 /100 | #332 | Tragic 25.8% |
| Immigrants | Switzerland | 0.0 /100 | #333 | Tragic 25.7% |
| Slovaks | 0.0 /100 | #334 | Tragic 25.7% |
| Immigrants | Croatia | 0.0 /100 | #335 | Tragic 25.7% |
| Immigrants | West Indies | 0.0 /100 | #336 | Tragic 25.7% |
| Puerto Ricans | 0.0 /100 | #337 | Tragic 25.6% |
| Arapaho | 0.0 /100 | #338 | Tragic 25.6% |
| Immigrants | St. Vincent and the Grenadines | 0.0 /100 | #339 | Tragic 25.6% |
| Immigrants | Armenia | 0.0 /100 | #340 | Tragic 25.6% |
| Immigrants | Serbia | 0.0 /100 | #341 | Tragic 25.5% |
| Alsatians | 0.0 /100 | #342 | Tragic 25.3% |
| Hopi | 0.0 /100 | #343 | Tragic 25.2% |