Fijian vs Apache Family Households with Children
COMPARE
Fijian
Apache
Family Households with Children
Family Households with Children Comparison
Fijians
Apache
29.0%
FAMILY HOUSEHOLDS WITH CHILDREN
100.0/ 100
METRIC RATING
45th/ 347
METRIC RANK
29.0%
FAMILY HOUSEHOLDS WITH CHILDREN
100.0/ 100
METRIC RATING
48th/ 347
METRIC RANK
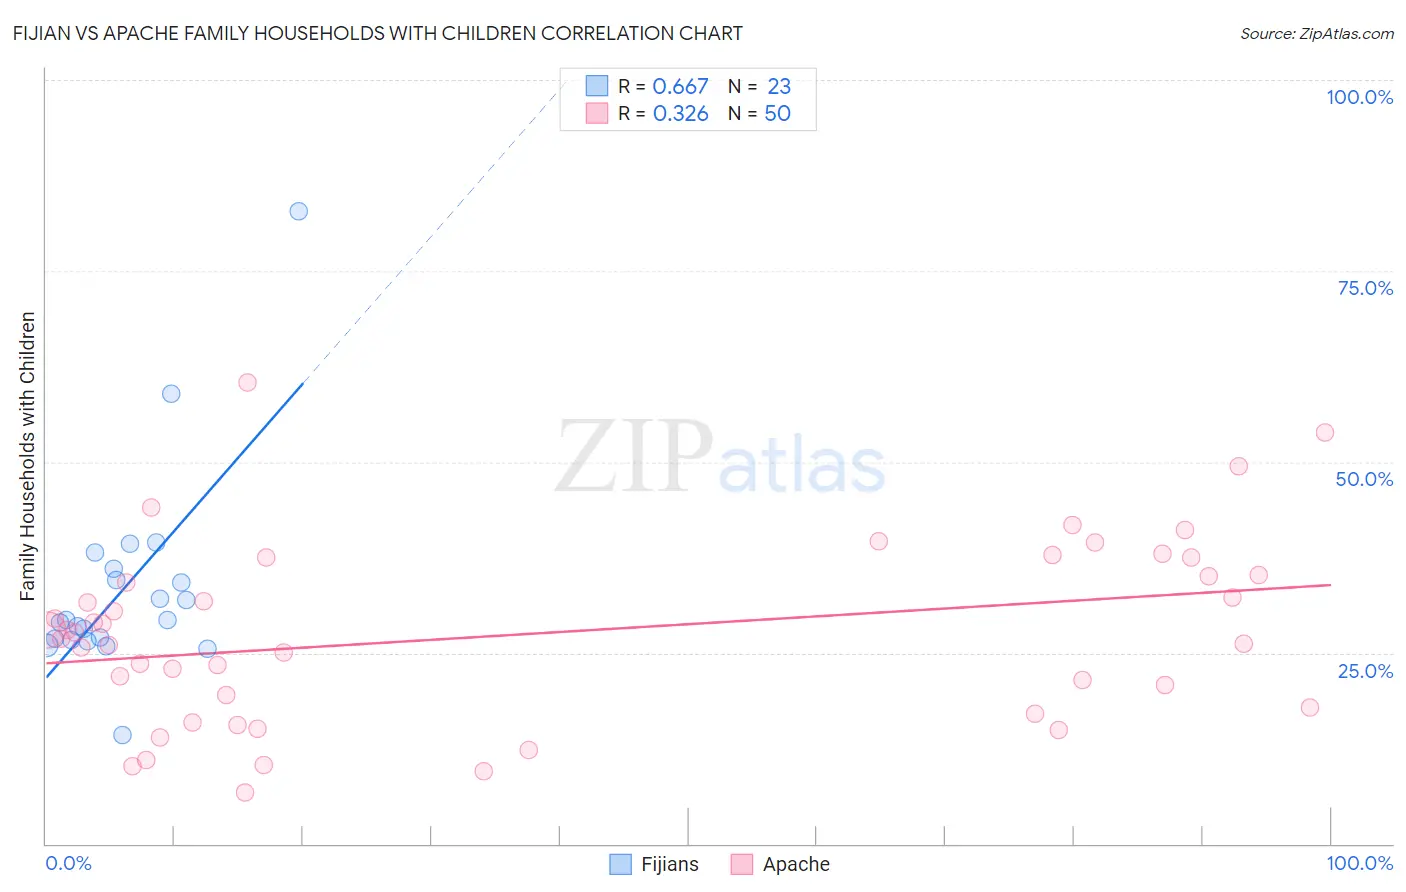
Fijian vs Apache Family Households with Children Correlation Chart
The statistical analysis conducted on geographies consisting of 55,947,867 people shows a significant positive correlation between the proportion of Fijians and percentage of family households with children in the United States with a correlation coefficient (R) of 0.667 and weighted average of 29.0%. Similarly, the statistical analysis conducted on geographies consisting of 231,023,024 people shows a mild positive correlation between the proportion of Apache and percentage of family households with children in the United States with a correlation coefficient (R) of 0.326 and weighted average of 29.0%, a difference of 0.13%.
Family Households with Children Correlation Summary
| Measurement | Fijian | Apache |
| Minimum | 14.3% | 6.8% |
| Maximum | 82.8% | 60.3% |
| Range | 68.5% | 53.6% |
| Mean | 33.5% | 27.5% |
| Median | 29.2% | 27.2% |
| Interquartile 25% (IQ1) | 26.6% | 17.8% |
| Interquartile 75% (IQ3) | 36.0% | 35.2% |
| Interquartile Range (IQR) | 9.4% | 17.4% |
| Standard Deviation (Sample) | 13.5% | 11.9% |
| Standard Deviation (Population) | 13.2% | 11.8% |
Demographics Similar to Fijians and Apache by Family Households with Children
In terms of family households with children, the demographic groups most similar to Fijians are Immigrants from Taiwan (29.0%, a difference of 0.060%), Immigrants from Philippines (29.0%, a difference of 0.090%), Peruvian (29.0%, a difference of 0.090%), Asian (29.1%, a difference of 0.10%), and Jordanian (29.0%, a difference of 0.21%). Similarly, the demographic groups most similar to Apache are Peruvian (29.0%, a difference of 0.030%), Immigrants from Philippines (29.0%, a difference of 0.040%), Jordanian (29.0%, a difference of 0.090%), Immigrants from Taiwan (29.0%, a difference of 0.18%), and Immigrants (28.9%, a difference of 0.20%).
| Demographics | Rating | Rank | Family Households with Children |
| Immigrants | Venezuela | 100.0 /100 | #36 | Exceptional 29.3% |
| Immigrants | Cameroon | 100.0 /100 | #37 | Exceptional 29.2% |
| Koreans | 100.0 /100 | #38 | Exceptional 29.2% |
| Yaqui | 100.0 /100 | #39 | Exceptional 29.1% |
| Central Americans | 100.0 /100 | #40 | Exceptional 29.1% |
| Immigrants | South Eastern Asia | 100.0 /100 | #41 | Exceptional 29.1% |
| Spanish American Indians | 100.0 /100 | #42 | Exceptional 29.1% |
| Asians | 100.0 /100 | #43 | Exceptional 29.1% |
| Immigrants | Taiwan | 100.0 /100 | #44 | Exceptional 29.0% |
| Fijians | 100.0 /100 | #45 | Exceptional 29.0% |
| Immigrants | Philippines | 100.0 /100 | #46 | Exceptional 29.0% |
| Peruvians | 100.0 /100 | #47 | Exceptional 29.0% |
| Apache | 100.0 /100 | #48 | Exceptional 29.0% |
| Jordanians | 100.0 /100 | #49 | Exceptional 29.0% |
| Immigrants | Immigrants | 100.0 /100 | #50 | Exceptional 28.9% |
| Immigrants | Peru | 100.0 /100 | #51 | Exceptional 28.9% |
| Guatemalans | 100.0 /100 | #52 | Exceptional 28.9% |
| Immigrants | Cambodia | 100.0 /100 | #53 | Exceptional 28.9% |
| Sierra Leoneans | 100.0 /100 | #54 | Exceptional 28.9% |
| Immigrants | Asia | 100.0 /100 | #55 | Exceptional 28.8% |
| Immigrants | Guatemala | 100.0 /100 | #56 | Exceptional 28.8% |