Immigrants from Somalia vs Apache Family Households with Children
COMPARE
Immigrants from Somalia
Apache
Family Households with Children
Family Households with Children Comparison
Immigrants from Somalia
Apache
26.3%
FAMILY HOUSEHOLDS WITH CHILDREN
0.0/ 100
METRIC RATING
309th/ 347
METRIC RANK
29.0%
FAMILY HOUSEHOLDS WITH CHILDREN
100.0/ 100
METRIC RATING
48th/ 347
METRIC RANK
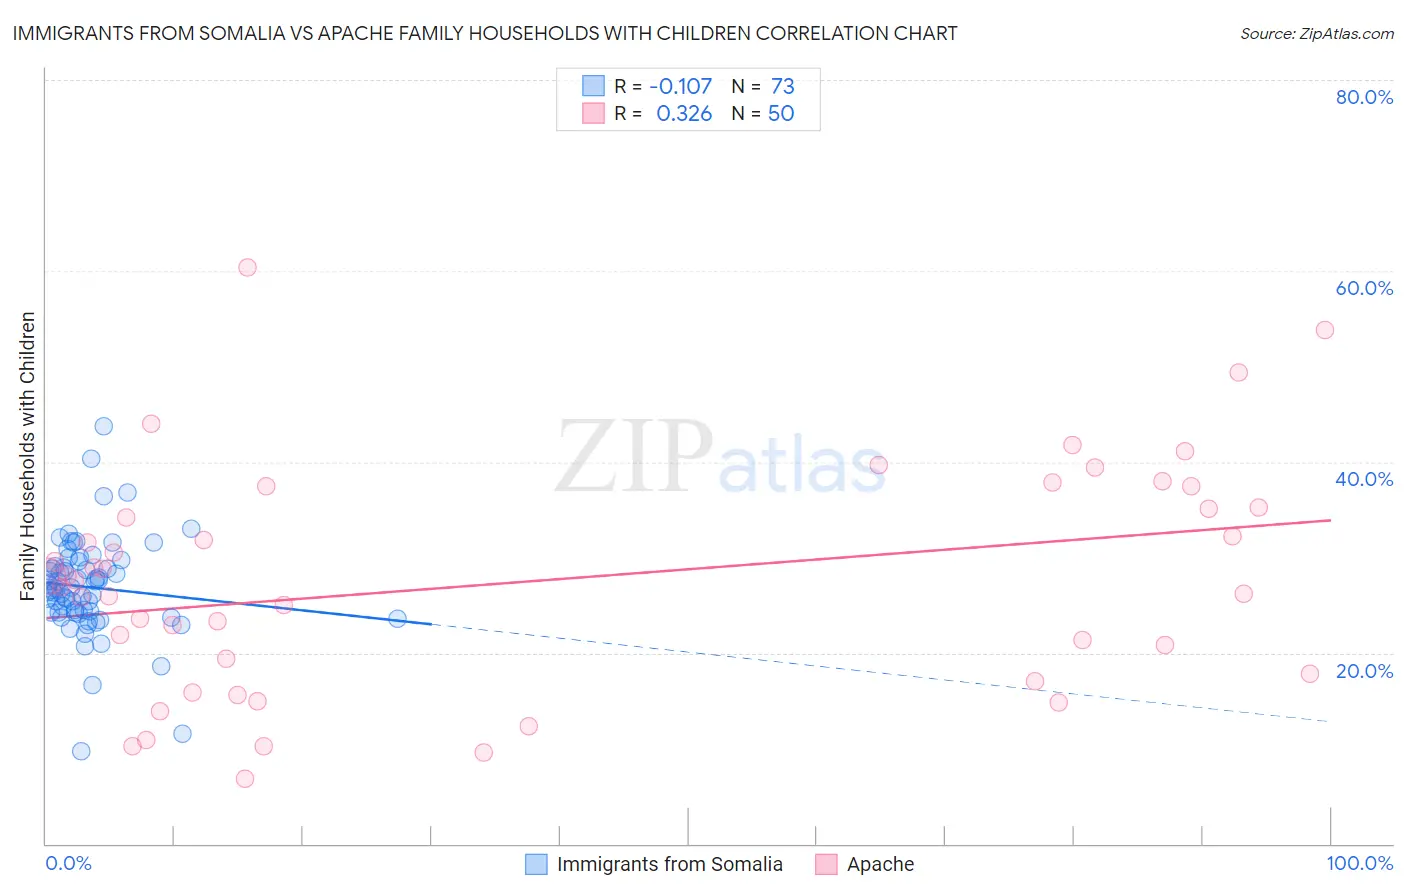
Immigrants from Somalia vs Apache Family Households with Children Correlation Chart
The statistical analysis conducted on geographies consisting of 92,093,079 people shows a poor negative correlation between the proportion of Immigrants from Somalia and percentage of family households with children in the United States with a correlation coefficient (R) of -0.107 and weighted average of 26.3%. Similarly, the statistical analysis conducted on geographies consisting of 231,023,024 people shows a mild positive correlation between the proportion of Apache and percentage of family households with children in the United States with a correlation coefficient (R) of 0.326 and weighted average of 29.0%, a difference of 10.4%.
Family Households with Children Correlation Summary
| Measurement | Immigrants from Somalia | Apache |
| Minimum | 9.6% | 6.8% |
| Maximum | 43.8% | 60.3% |
| Range | 34.2% | 53.6% |
| Mean | 26.9% | 27.5% |
| Median | 26.7% | 27.2% |
| Interquartile 25% (IQ1) | 24.2% | 17.8% |
| Interquartile 75% (IQ3) | 29.3% | 35.2% |
| Interquartile Range (IQR) | 5.1% | 17.4% |
| Standard Deviation (Sample) | 5.2% | 11.9% |
| Standard Deviation (Population) | 5.2% | 11.8% |
Similar Demographics by Family Households with Children
Demographics Similar to Immigrants from Somalia by Family Households with Children
In terms of family households with children, the demographic groups most similar to Immigrants from Somalia are Marshallese (26.2%, a difference of 0.050%), Colville (26.2%, a difference of 0.090%), Lumbee (26.3%, a difference of 0.11%), West Indian (26.3%, a difference of 0.13%), and Immigrants from Czechoslovakia (26.2%, a difference of 0.16%).
| Demographics | Rating | Rank | Family Households with Children |
| Serbians | 0.1 /100 | #302 | Tragic 26.4% |
| Immigrants | Guyana | 0.1 /100 | #303 | Tragic 26.3% |
| Immigrants | Bahamas | 0.1 /100 | #304 | Tragic 26.3% |
| Guyanese | 0.1 /100 | #305 | Tragic 26.3% |
| Bermudans | 0.1 /100 | #306 | Tragic 26.3% |
| West Indians | 0.0 /100 | #307 | Tragic 26.3% |
| Lumbee | 0.0 /100 | #308 | Tragic 26.3% |
| Immigrants | Somalia | 0.0 /100 | #309 | Tragic 26.3% |
| Marshallese | 0.0 /100 | #310 | Tragic 26.2% |
| Colville | 0.0 /100 | #311 | Tragic 26.2% |
| Immigrants | Czechoslovakia | 0.0 /100 | #312 | Tragic 26.2% |
| Cree | 0.0 /100 | #313 | Tragic 26.2% |
| French Canadians | 0.0 /100 | #314 | Tragic 26.1% |
| Immigrants | Norway | 0.0 /100 | #315 | Tragic 26.1% |
| Estonians | 0.0 /100 | #316 | Tragic 26.1% |
Demographics Similar to Apache by Family Households with Children
In terms of family households with children, the demographic groups most similar to Apache are Peruvian (29.0%, a difference of 0.030%), Immigrants from Philippines (29.0%, a difference of 0.040%), Jordanian (29.0%, a difference of 0.090%), Fijian (29.0%, a difference of 0.13%), and Immigrants from Taiwan (29.0%, a difference of 0.18%).
| Demographics | Rating | Rank | Family Households with Children |
| Immigrants | South Eastern Asia | 100.0 /100 | #41 | Exceptional 29.1% |
| Spanish American Indians | 100.0 /100 | #42 | Exceptional 29.1% |
| Asians | 100.0 /100 | #43 | Exceptional 29.1% |
| Immigrants | Taiwan | 100.0 /100 | #44 | Exceptional 29.0% |
| Fijians | 100.0 /100 | #45 | Exceptional 29.0% |
| Immigrants | Philippines | 100.0 /100 | #46 | Exceptional 29.0% |
| Peruvians | 100.0 /100 | #47 | Exceptional 29.0% |
| Apache | 100.0 /100 | #48 | Exceptional 29.0% |
| Jordanians | 100.0 /100 | #49 | Exceptional 29.0% |
| Immigrants | Immigrants | 100.0 /100 | #50 | Exceptional 28.9% |
| Immigrants | Peru | 100.0 /100 | #51 | Exceptional 28.9% |
| Guatemalans | 100.0 /100 | #52 | Exceptional 28.9% |
| Immigrants | Cambodia | 100.0 /100 | #53 | Exceptional 28.9% |
| Sierra Leoneans | 100.0 /100 | #54 | Exceptional 28.9% |
| Immigrants | Asia | 100.0 /100 | #55 | Exceptional 28.8% |