Estonian vs South American Indian Associate's Degree
COMPARE
Estonian
South American Indian
Associate's Degree
Associate's Degree Comparison
Estonians
South American Indians
52.5%
ASSOCIATE'S DEGREE
99.9/ 100
METRIC RATING
44th/ 347
METRIC RANK
47.4%
ASSOCIATE'S DEGREE
76.7/ 100
METRIC RATING
148th/ 347
METRIC RANK
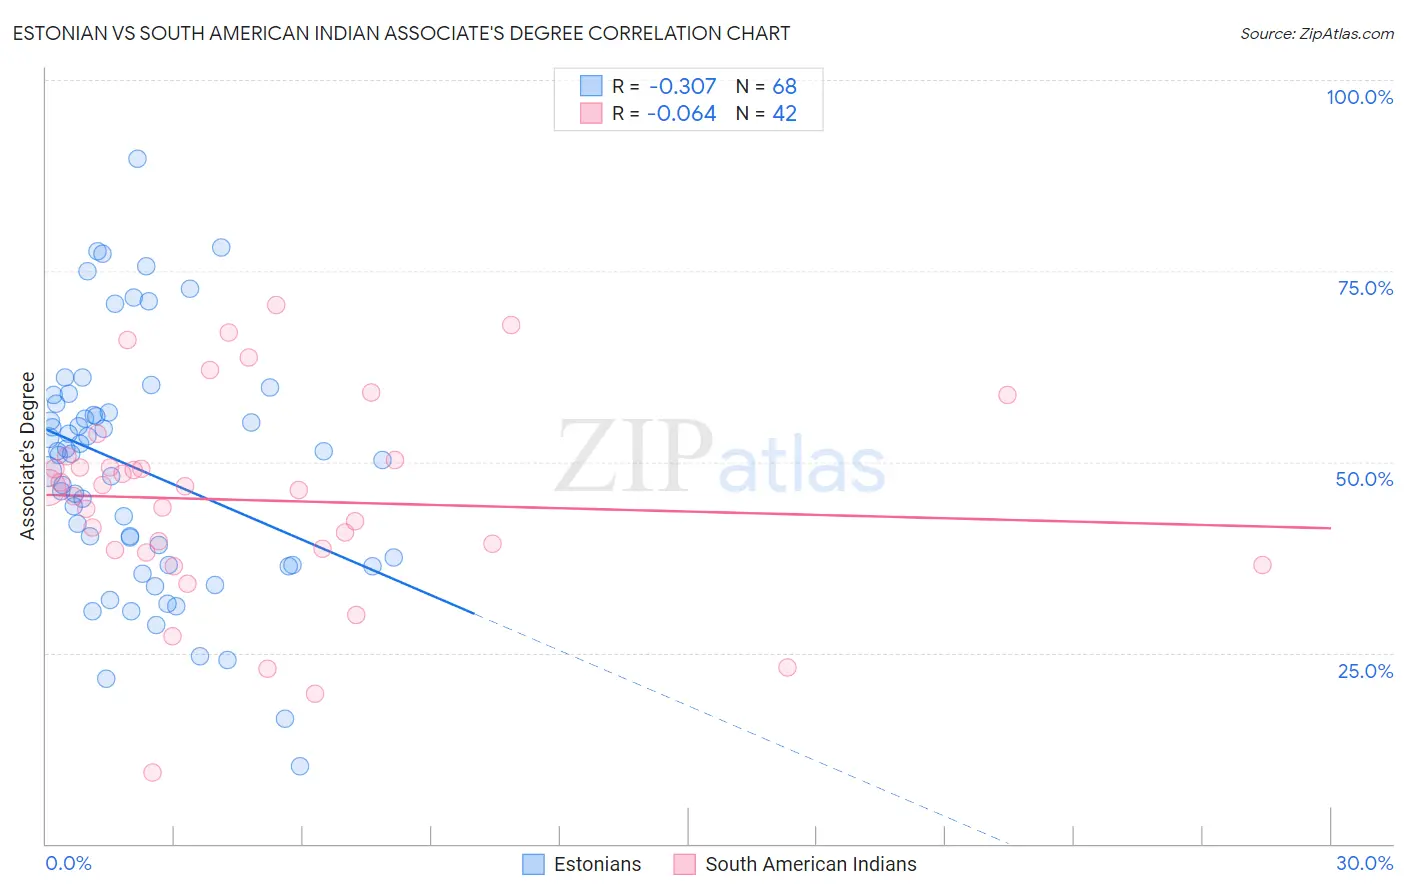
Estonian vs South American Indian Associate's Degree Correlation Chart
The statistical analysis conducted on geographies consisting of 123,528,324 people shows a mild negative correlation between the proportion of Estonians and percentage of population with at least associate's degree education in the United States with a correlation coefficient (R) of -0.307 and weighted average of 52.5%. Similarly, the statistical analysis conducted on geographies consisting of 164,573,088 people shows a slight negative correlation between the proportion of South American Indians and percentage of population with at least associate's degree education in the United States with a correlation coefficient (R) of -0.064 and weighted average of 47.4%, a difference of 10.8%.
Associate's Degree Correlation Summary
| Measurement | Estonian | South American Indian |
| Minimum | 10.2% | 9.4% |
| Maximum | 89.7% | 70.6% |
| Range | 79.5% | 61.2% |
| Mean | 49.0% | 45.0% |
| Median | 51.0% | 46.5% |
| Interquartile 25% (IQ1) | 36.5% | 38.4% |
| Interquartile 75% (IQ3) | 57.1% | 50.2% |
| Interquartile Range (IQR) | 20.5% | 11.8% |
| Standard Deviation (Sample) | 16.0% | 13.3% |
| Standard Deviation (Population) | 15.9% | 13.2% |
Similar Demographics by Associate's Degree
Demographics Similar to Estonians by Associate's Degree
In terms of associate's degree, the demographic groups most similar to Estonians are Immigrants from Lithuania (52.4%, a difference of 0.080%), Immigrants from South Africa (52.5%, a difference of 0.090%), Immigrants from Malaysia (52.5%, a difference of 0.10%), Immigrants from Saudi Arabia (52.6%, a difference of 0.13%), and Immigrants from Bulgaria (52.4%, a difference of 0.21%).
| Demographics | Rating | Rank | Associate's Degree |
| Immigrants | Denmark | 100.0 /100 | #37 | Exceptional 53.1% |
| Mongolians | 100.0 /100 | #38 | Exceptional 53.0% |
| Immigrants | Belarus | 99.9 /100 | #39 | Exceptional 52.8% |
| Immigrants | Latvia | 99.9 /100 | #40 | Exceptional 52.8% |
| Immigrants | Saudi Arabia | 99.9 /100 | #41 | Exceptional 52.6% |
| Immigrants | Malaysia | 99.9 /100 | #42 | Exceptional 52.5% |
| Immigrants | South Africa | 99.9 /100 | #43 | Exceptional 52.5% |
| Estonians | 99.9 /100 | #44 | Exceptional 52.5% |
| Immigrants | Lithuania | 99.9 /100 | #45 | Exceptional 52.4% |
| Immigrants | Bulgaria | 99.9 /100 | #46 | Exceptional 52.4% |
| Immigrants | Kuwait | 99.9 /100 | #47 | Exceptional 52.4% |
| Immigrants | Norway | 99.9 /100 | #48 | Exceptional 52.2% |
| Immigrants | Austria | 99.9 /100 | #49 | Exceptional 52.1% |
| Asians | 99.9 /100 | #50 | Exceptional 52.1% |
| Immigrants | Greece | 99.9 /100 | #51 | Exceptional 52.1% |
Demographics Similar to South American Indians by Associate's Degree
In terms of associate's degree, the demographic groups most similar to South American Indians are Immigrants from Armenia (47.4%, a difference of 0.010%), Iraqi (47.4%, a difference of 0.050%), Danish (47.4%, a difference of 0.060%), Immigrants from North Macedonia (47.4%, a difference of 0.070%), and Immigrants from Sudan (47.4%, a difference of 0.12%).
| Demographics | Rating | Rank | Associate's Degree |
| Taiwanese | 83.3 /100 | #141 | Excellent 47.7% |
| Sierra Leoneans | 82.9 /100 | #142 | Excellent 47.7% |
| Norwegians | 81.0 /100 | #143 | Excellent 47.6% |
| Slavs | 80.5 /100 | #144 | Excellent 47.6% |
| Canadians | 79.0 /100 | #145 | Good 47.5% |
| Immigrants | Sudan | 77.9 /100 | #146 | Good 47.4% |
| Danes | 77.3 /100 | #147 | Good 47.4% |
| South American Indians | 76.7 /100 | #148 | Good 47.4% |
| Immigrants | Armenia | 76.6 /100 | #149 | Good 47.4% |
| Iraqis | 76.2 /100 | #150 | Good 47.4% |
| Immigrants | North Macedonia | 76.0 /100 | #151 | Good 47.4% |
| Immigrants | Afghanistan | 74.3 /100 | #152 | Good 47.3% |
| Czechs | 72.2 /100 | #153 | Good 47.2% |
| Immigrants | Kenya | 72.1 /100 | #154 | Good 47.2% |
| Kenyans | 70.6 /100 | #155 | Good 47.1% |