Immigrants from Vietnam vs South American Indian Family Households
COMPARE
Immigrants from Vietnam
South American Indian
Family Households
Family Households Comparison
Immigrants from Vietnam
South American Indians
68.2%
FAMILY HOUSEHOLDS
100.0/ 100
METRIC RATING
16th/ 347
METRIC RANK
64.6%
FAMILY HOUSEHOLDS
81.9/ 100
METRIC RATING
144th/ 347
METRIC RANK
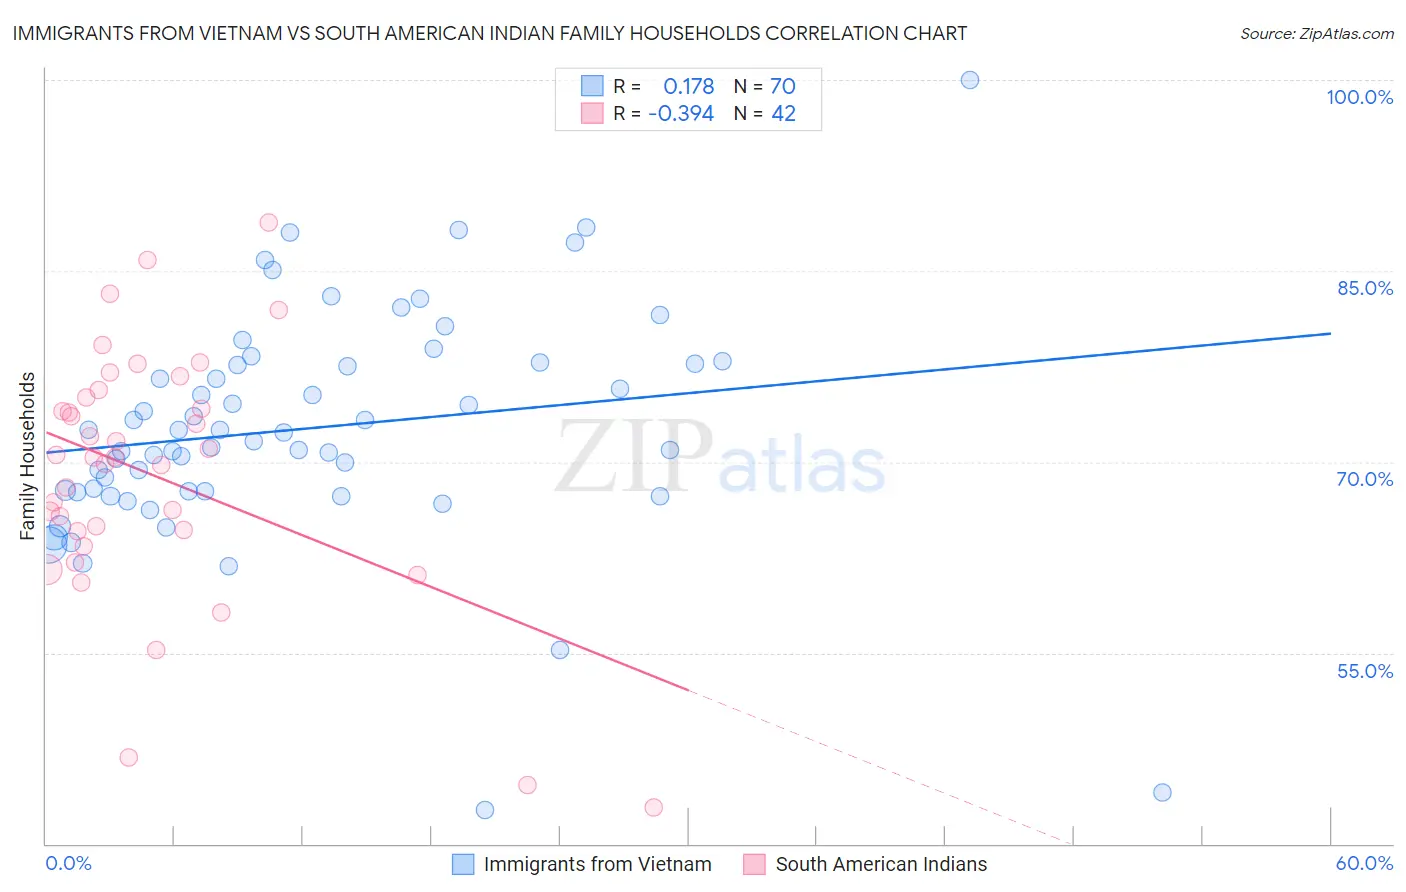
Immigrants from Vietnam vs South American Indian Family Households Correlation Chart
The statistical analysis conducted on geographies consisting of 404,558,731 people shows a poor positive correlation between the proportion of Immigrants from Vietnam and percentage of family households in the United States with a correlation coefficient (R) of 0.178 and weighted average of 68.2%. Similarly, the statistical analysis conducted on geographies consisting of 164,540,449 people shows a mild negative correlation between the proportion of South American Indians and percentage of family households in the United States with a correlation coefficient (R) of -0.394 and weighted average of 64.6%, a difference of 5.5%.
Family Households Correlation Summary
| Measurement | Immigrants from Vietnam | South American Indian |
| Minimum | 42.7% | 42.9% |
| Maximum | 100.0% | 88.8% |
| Range | 57.3% | 45.9% |
| Mean | 72.6% | 69.0% |
| Median | 72.0% | 70.3% |
| Interquartile 25% (IQ1) | 67.7% | 64.6% |
| Interquartile 75% (IQ3) | 77.7% | 75.0% |
| Interquartile Range (IQR) | 10.0% | 10.5% |
| Standard Deviation (Sample) | 9.2% | 10.0% |
| Standard Deviation (Population) | 9.1% | 9.9% |
Similar Demographics by Family Households
Demographics Similar to Immigrants from Vietnam by Family Households
In terms of family households, the demographic groups most similar to Immigrants from Vietnam are Assyrian/Chaldean/Syriac (68.2%, a difference of 0.0%), Chinese (68.1%, a difference of 0.030%), Immigrants from Cuba (68.2%, a difference of 0.060%), Pueblo (68.2%, a difference of 0.070%), and Korean (68.3%, a difference of 0.15%).
| Demographics | Rating | Rank | Family Households |
| Native Hawaiians | 100.0 /100 | #9 | Exceptional 68.4% |
| Immigrants | Philippines | 100.0 /100 | #10 | Exceptional 68.3% |
| Immigrants | Central America | 100.0 /100 | #11 | Exceptional 68.3% |
| Koreans | 100.0 /100 | #12 | Exceptional 68.3% |
| Pueblo | 100.0 /100 | #13 | Exceptional 68.2% |
| Immigrants | Cuba | 100.0 /100 | #14 | Exceptional 68.2% |
| Assyrians/Chaldeans/Syriacs | 100.0 /100 | #15 | Exceptional 68.2% |
| Immigrants | Vietnam | 100.0 /100 | #16 | Exceptional 68.2% |
| Chinese | 100.0 /100 | #17 | Exceptional 68.1% |
| Immigrants | Taiwan | 100.0 /100 | #18 | Exceptional 68.0% |
| Samoans | 100.0 /100 | #19 | Exceptional 67.9% |
| Inupiat | 100.0 /100 | #20 | Exceptional 67.8% |
| Cubans | 100.0 /100 | #21 | Exceptional 67.7% |
| Sri Lankans | 100.0 /100 | #22 | Exceptional 67.7% |
| Immigrants | Pakistan | 100.0 /100 | #23 | Exceptional 67.7% |
Demographics Similar to South American Indians by Family Households
In terms of family households, the demographic groups most similar to South American Indians are Czechoslovakian (64.6%, a difference of 0.0%), Welsh (64.6%, a difference of 0.040%), Pakistani (64.7%, a difference of 0.050%), Immigrants from North Macedonia (64.7%, a difference of 0.070%), and Immigrants from Cameroon (64.7%, a difference of 0.070%).
| Demographics | Rating | Rank | Family Households |
| Immigrants | Scotland | 86.4 /100 | #137 | Excellent 64.7% |
| Basques | 85.5 /100 | #138 | Excellent 64.7% |
| Immigrants | Jamaica | 85.3 /100 | #139 | Excellent 64.7% |
| Immigrants | North Macedonia | 84.9 /100 | #140 | Excellent 64.7% |
| Immigrants | Cameroon | 84.8 /100 | #141 | Excellent 64.7% |
| Pakistanis | 84.0 /100 | #142 | Excellent 64.7% |
| Czechoslovakians | 82.1 /100 | #143 | Excellent 64.6% |
| South American Indians | 81.9 /100 | #144 | Excellent 64.6% |
| Welsh | 80.1 /100 | #145 | Excellent 64.6% |
| Immigrants | Romania | 77.0 /100 | #146 | Good 64.6% |
| Immigrants | Chile | 76.5 /100 | #147 | Good 64.6% |
| Delaware | 76.3 /100 | #148 | Good 64.6% |
| Sioux | 76.3 /100 | #149 | Good 64.6% |
| Romanians | 75.3 /100 | #150 | Good 64.5% |
| Syrians | 75.2 /100 | #151 | Good 64.5% |