English vs Romanian Married-couple Households
COMPARE
English
Romanian
Married-couple Households
Married-couple Households Comparison
English
Romanians
49.6%
MARRIED-COUPLE HOUSEHOLDS
99.9/ 100
METRIC RATING
18th/ 347
METRIC RANK
48.4%
MARRIED-COUPLE HOUSEHOLDS
98.9/ 100
METRIC RATING
67th/ 347
METRIC RANK
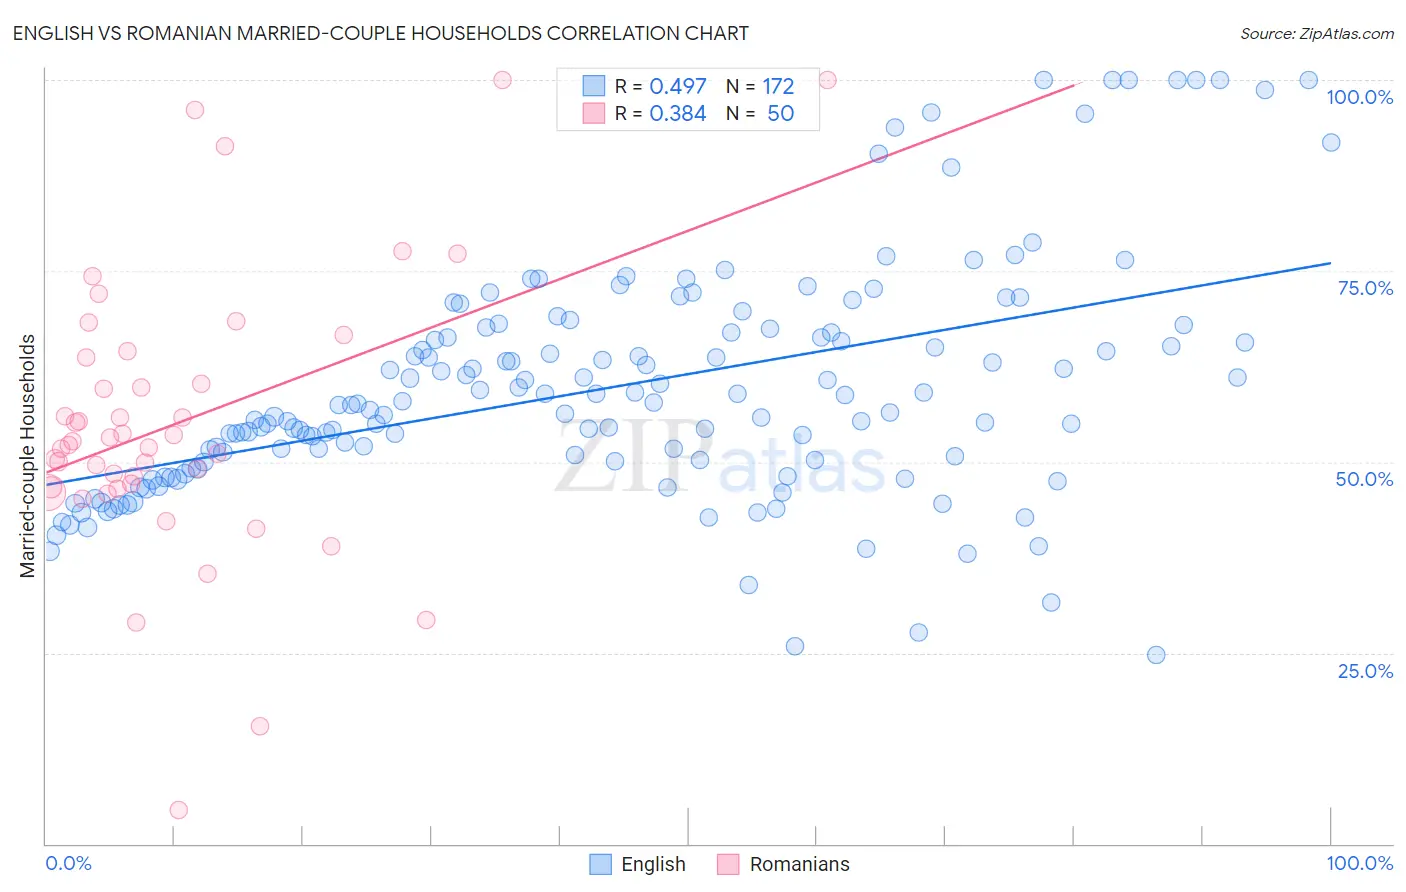
English vs Romanian Married-couple Households Correlation Chart
The statistical analysis conducted on geographies consisting of 579,267,782 people shows a moderate positive correlation between the proportion of English and percentage of married-couple family households in the United States with a correlation coefficient (R) of 0.497 and weighted average of 49.6%. Similarly, the statistical analysis conducted on geographies consisting of 377,697,282 people shows a mild positive correlation between the proportion of Romanians and percentage of married-couple family households in the United States with a correlation coefficient (R) of 0.384 and weighted average of 48.4%, a difference of 2.5%.
Married-couple Households Correlation Summary
| Measurement | English | Romanian |
| Minimum | 24.7% | 4.5% |
| Maximum | 100.0% | 100.0% |
| Range | 75.3% | 95.5% |
| Mean | 59.7% | 55.1% |
| Median | 57.5% | 52.5% |
| Interquartile 25% (IQ1) | 50.0% | 46.7% |
| Interquartile 75% (IQ3) | 66.9% | 63.6% |
| Interquartile Range (IQR) | 16.9% | 17.0% |
| Standard Deviation (Sample) | 15.3% | 18.4% |
| Standard Deviation (Population) | 15.3% | 18.3% |
Similar Demographics by Married-couple Households
Demographics Similar to English by Married-couple Households
In terms of married-couple households, the demographic groups most similar to English are Immigrants from Hong Kong (49.6%, a difference of 0.010%), Swedish (49.7%, a difference of 0.16%), European (49.6%, a difference of 0.16%), Scandinavian (49.6%, a difference of 0.17%), and Korean (49.7%, a difference of 0.19%).
| Demographics | Rating | Rank | Married-couple Households |
| Immigrants | Pakistan | 100.0 /100 | #11 | Exceptional 50.1% |
| Swiss | 100.0 /100 | #12 | Exceptional 49.9% |
| Immigrants | Korea | 100.0 /100 | #13 | Exceptional 49.9% |
| Burmese | 100.0 /100 | #14 | Exceptional 49.8% |
| Koreans | 99.9 /100 | #15 | Exceptional 49.7% |
| Swedes | 99.9 /100 | #16 | Exceptional 49.7% |
| Immigrants | Hong Kong | 99.9 /100 | #17 | Exceptional 49.6% |
| English | 99.9 /100 | #18 | Exceptional 49.6% |
| Europeans | 99.9 /100 | #19 | Exceptional 49.6% |
| Scandinavians | 99.9 /100 | #20 | Exceptional 49.6% |
| Norwegians | 99.9 /100 | #21 | Exceptional 49.5% |
| Asians | 99.9 /100 | #22 | Exceptional 49.5% |
| Dutch | 99.9 /100 | #23 | Exceptional 49.5% |
| Czechs | 99.9 /100 | #24 | Exceptional 49.4% |
| Immigrants | Philippines | 99.9 /100 | #25 | Exceptional 49.3% |
Demographics Similar to Romanians by Married-couple Households
In terms of married-couple households, the demographic groups most similar to Romanians are Jordanian (48.4%, a difference of 0.0%), Immigrants from South Eastern Asia (48.4%, a difference of 0.010%), Immigrants from China (48.4%, a difference of 0.010%), Immigrants from Canada (48.4%, a difference of 0.030%), and Northern European (48.4%, a difference of 0.050%).
| Demographics | Rating | Rank | Married-couple Households |
| Croatians | 99.1 /100 | #60 | Exceptional 48.5% |
| Bulgarians | 99.1 /100 | #61 | Exceptional 48.5% |
| Luxembourgers | 99.1 /100 | #62 | Exceptional 48.5% |
| Basques | 99.0 /100 | #63 | Exceptional 48.4% |
| Northern Europeans | 99.0 /100 | #64 | Exceptional 48.4% |
| Immigrants | Canada | 99.0 /100 | #65 | Exceptional 48.4% |
| Jordanians | 98.9 /100 | #66 | Exceptional 48.4% |
| Romanians | 98.9 /100 | #67 | Exceptional 48.4% |
| Immigrants | South Eastern Asia | 98.9 /100 | #68 | Exceptional 48.4% |
| Immigrants | China | 98.9 /100 | #69 | Exceptional 48.4% |
| Immigrants | North America | 98.9 /100 | #70 | Exceptional 48.4% |
| Laotians | 98.8 /100 | #71 | Exceptional 48.4% |
| Scotch-Irish | 98.6 /100 | #72 | Exceptional 48.3% |
| Immigrants | Singapore | 98.6 /100 | #73 | Exceptional 48.3% |
| Immigrants | Romania | 98.6 /100 | #74 | Exceptional 48.3% |