Yup'ik vs Romanian Married-couple Households
COMPARE
Yup'ik
Romanian
Married-couple Households
Married-couple Households Comparison
Yup'ik
Romanians
44.1%
MARRIED-COUPLE HOUSEHOLDS
0.4/ 100
METRIC RATING
248th/ 347
METRIC RANK
48.4%
MARRIED-COUPLE HOUSEHOLDS
98.9/ 100
METRIC RATING
67th/ 347
METRIC RANK
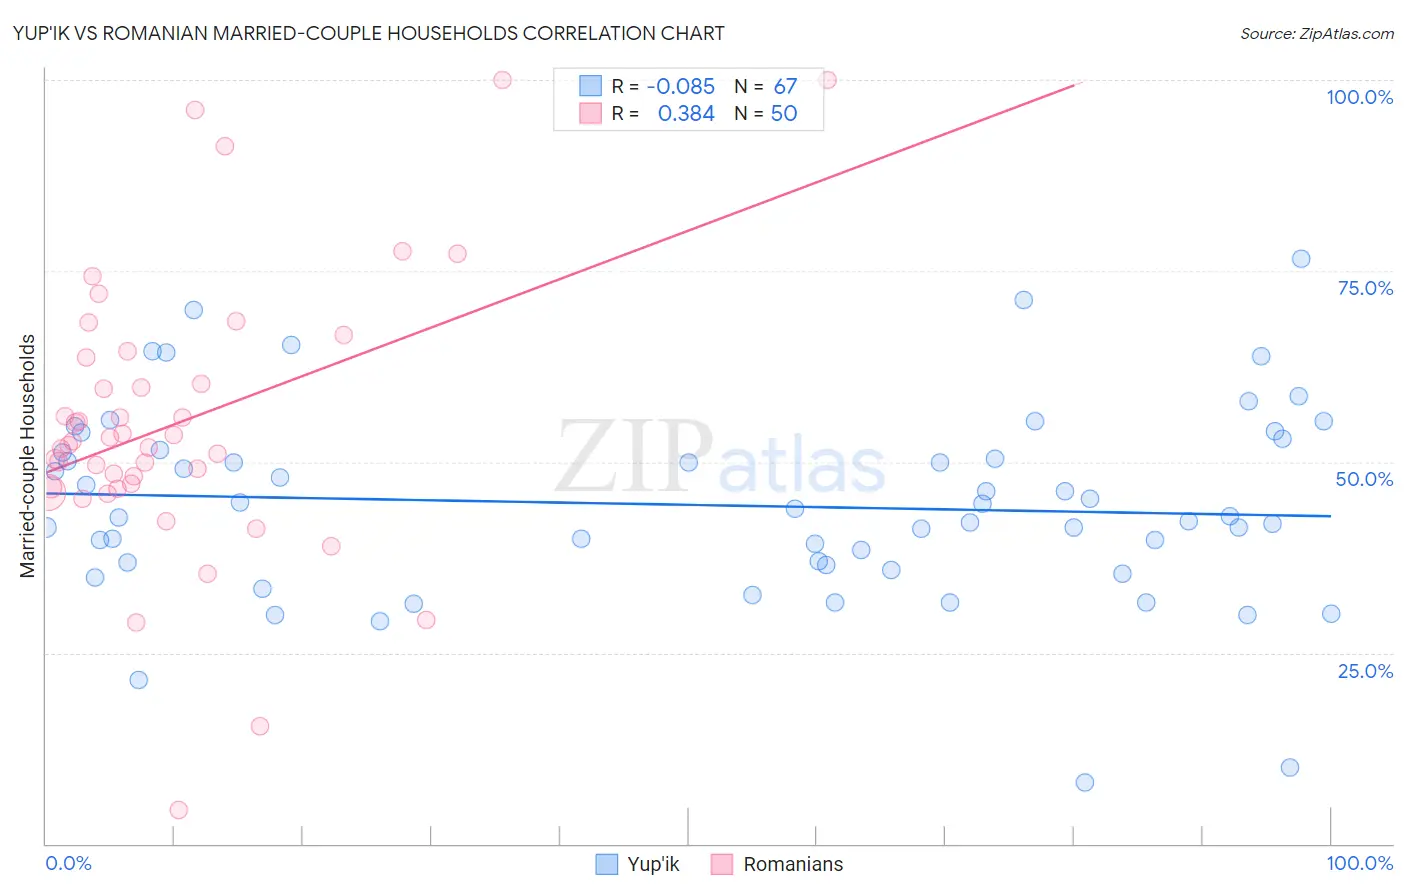
Yup'ik vs Romanian Married-couple Households Correlation Chart
The statistical analysis conducted on geographies consisting of 39,956,684 people shows a slight negative correlation between the proportion of Yup'ik and percentage of married-couple family households in the United States with a correlation coefficient (R) of -0.085 and weighted average of 44.1%. Similarly, the statistical analysis conducted on geographies consisting of 377,697,282 people shows a mild positive correlation between the proportion of Romanians and percentage of married-couple family households in the United States with a correlation coefficient (R) of 0.384 and weighted average of 48.4%, a difference of 9.9%.
Married-couple Households Correlation Summary
| Measurement | Yup'ik | Romanian |
| Minimum | 8.0% | 4.5% |
| Maximum | 76.7% | 100.0% |
| Range | 68.7% | 95.5% |
| Mean | 44.4% | 55.1% |
| Median | 42.9% | 52.5% |
| Interquartile 25% (IQ1) | 36.5% | 46.7% |
| Interquartile 75% (IQ3) | 51.5% | 63.6% |
| Interquartile Range (IQR) | 15.1% | 17.0% |
| Standard Deviation (Sample) | 12.8% | 18.4% |
| Standard Deviation (Population) | 12.8% | 18.3% |
Similar Demographics by Married-couple Households
Demographics Similar to Yup'ik by Married-couple Households
In terms of married-couple households, the demographic groups most similar to Yup'ik are Immigrants from Kenya (44.1%, a difference of 0.050%), French American Indian (44.1%, a difference of 0.050%), German Russian (44.0%, a difference of 0.14%), Seminole (44.0%, a difference of 0.20%), and Immigrants from Cuba (44.2%, a difference of 0.28%).
| Demographics | Rating | Rank | Married-couple Households |
| Immigrants | Bosnia and Herzegovina | 1.0 /100 | #241 | Tragic 44.4% |
| Immigrants | Albania | 1.0 /100 | #242 | Tragic 44.4% |
| Immigrants | Saudi Arabia | 0.9 /100 | #243 | Tragic 44.4% |
| Immigrants | Armenia | 0.7 /100 | #244 | Tragic 44.3% |
| Immigrants | El Salvador | 0.7 /100 | #245 | Tragic 44.3% |
| Immigrants | Cuba | 0.6 /100 | #246 | Tragic 44.2% |
| Immigrants | Morocco | 0.6 /100 | #247 | Tragic 44.2% |
| Yup'ik | 0.4 /100 | #248 | Tragic 44.1% |
| Immigrants | Kenya | 0.4 /100 | #249 | Tragic 44.1% |
| French American Indians | 0.4 /100 | #250 | Tragic 44.1% |
| German Russians | 0.4 /100 | #251 | Tragic 44.0% |
| Seminole | 0.4 /100 | #252 | Tragic 44.0% |
| Central Americans | 0.3 /100 | #253 | Tragic 43.9% |
| Apache | 0.3 /100 | #254 | Tragic 43.9% |
| Shoshone | 0.3 /100 | #255 | Tragic 43.9% |
Demographics Similar to Romanians by Married-couple Households
In terms of married-couple households, the demographic groups most similar to Romanians are Jordanian (48.4%, a difference of 0.0%), Immigrants from South Eastern Asia (48.4%, a difference of 0.010%), Immigrants from China (48.4%, a difference of 0.010%), Immigrants from Canada (48.4%, a difference of 0.030%), and Northern European (48.4%, a difference of 0.050%).
| Demographics | Rating | Rank | Married-couple Households |
| Croatians | 99.1 /100 | #60 | Exceptional 48.5% |
| Bulgarians | 99.1 /100 | #61 | Exceptional 48.5% |
| Luxembourgers | 99.1 /100 | #62 | Exceptional 48.5% |
| Basques | 99.0 /100 | #63 | Exceptional 48.4% |
| Northern Europeans | 99.0 /100 | #64 | Exceptional 48.4% |
| Immigrants | Canada | 99.0 /100 | #65 | Exceptional 48.4% |
| Jordanians | 98.9 /100 | #66 | Exceptional 48.4% |
| Romanians | 98.9 /100 | #67 | Exceptional 48.4% |
| Immigrants | South Eastern Asia | 98.9 /100 | #68 | Exceptional 48.4% |
| Immigrants | China | 98.9 /100 | #69 | Exceptional 48.4% |
| Immigrants | North America | 98.9 /100 | #70 | Exceptional 48.4% |
| Laotians | 98.8 /100 | #71 | Exceptional 48.4% |
| Scotch-Irish | 98.6 /100 | #72 | Exceptional 48.3% |
| Immigrants | Singapore | 98.6 /100 | #73 | Exceptional 48.3% |
| Immigrants | Romania | 98.6 /100 | #74 | Exceptional 48.3% |