English vs Romanian Median Family Income
COMPARE
English
Romanian
Median Family Income
Median Family Income Comparison
English
Romanians
$103,684
MEDIAN FAMILY INCOME
62.6/ 100
METRIC RATING
166th/ 347
METRIC RANK
$111,243
MEDIAN FAMILY INCOME
98.8/ 100
METRIC RATING
88th/ 347
METRIC RANK
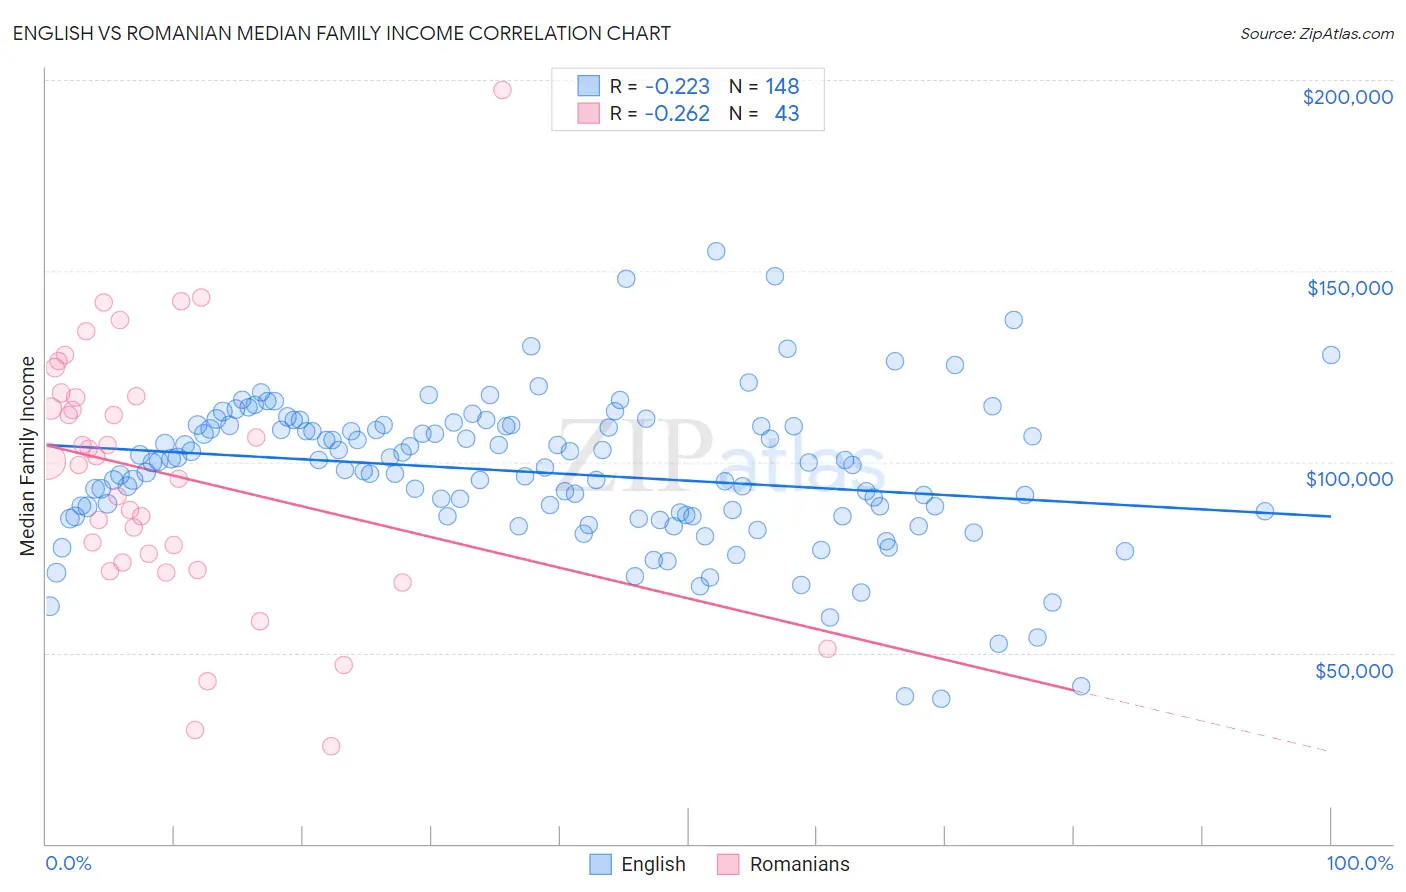
English vs Romanian Median Family Income Correlation Chart
The statistical analysis conducted on geographies consisting of 578,007,512 people shows a weak negative correlation between the proportion of English and median family income in the United States with a correlation coefficient (R) of -0.223 and weighted average of $103,684. Similarly, the statistical analysis conducted on geographies consisting of 377,611,628 people shows a weak negative correlation between the proportion of Romanians and median family income in the United States with a correlation coefficient (R) of -0.262 and weighted average of $111,243, a difference of 7.3%.
Median Family Income Correlation Summary
| Measurement | English | Romanian |
| Minimum | $37,941 | $25,417 |
| Maximum | $155,034 | $197,500 |
| Range | $117,093 | $172,083 |
| Mean | $97,321 | $96,934 |
| Median | $99,521 | $100,017 |
| Interquartile 25% (IQ1) | $86,021 | $73,551 |
| Interquartile 75% (IQ3) | $109,417 | $117,024 |
| Interquartile Range (IQR) | $23,396 | $43,473 |
| Standard Deviation (Sample) | $19,404 | $33,876 |
| Standard Deviation (Population) | $19,339 | $33,480 |
Similar Demographics by Median Family Income
Demographics Similar to English by Median Family Income
In terms of median family income, the demographic groups most similar to English are Slovak ($103,729, a difference of 0.040%), South American Indian ($103,624, a difference of 0.060%), Immigrants from Peru ($103,534, a difference of 0.15%), Sierra Leonean ($103,859, a difference of 0.17%), and Immigrants from Sierra Leone ($103,990, a difference of 0.29%).
| Demographics | Rating | Rank | Median Family Income |
| Swiss | 70.7 /100 | #159 | Good $104,396 |
| Scottish | 69.5 /100 | #160 | Good $104,288 |
| Icelanders | 69.4 /100 | #161 | Good $104,282 |
| Immigrants | Sierra Leone | 66.2 /100 | #162 | Good $103,990 |
| Costa Ricans | 66.2 /100 | #163 | Good $103,989 |
| Sierra Leoneans | 64.7 /100 | #164 | Good $103,859 |
| Slovaks | 63.1 /100 | #165 | Good $103,729 |
| English | 62.6 /100 | #166 | Good $103,684 |
| South American Indians | 61.9 /100 | #167 | Good $103,624 |
| Immigrants | Peru | 60.8 /100 | #168 | Good $103,534 |
| Czechoslovakians | 57.6 /100 | #169 | Average $103,273 |
| Immigrants | Uzbekistan | 56.6 /100 | #170 | Average $103,197 |
| Alsatians | 54.3 /100 | #171 | Average $103,010 |
| Immigrants | Eritrea | 51.9 /100 | #172 | Average $102,823 |
| Belgians | 51.4 /100 | #173 | Average $102,788 |
Demographics Similar to Romanians by Median Family Income
In terms of median family income, the demographic groups most similar to Romanians are Austrian ($111,306, a difference of 0.060%), Croatian ($111,370, a difference of 0.11%), Ukrainian ($111,368, a difference of 0.11%), Immigrants from Hungary ($111,378, a difference of 0.12%), and Immigrants from Argentina ($110,873, a difference of 0.33%).
| Demographics | Rating | Rank | Median Family Income |
| Immigrants | North America | 99.2 /100 | #81 | Exceptional $112,151 |
| Immigrants | England | 99.2 /100 | #82 | Exceptional $112,038 |
| Immigrants | Egypt | 99.0 /100 | #83 | Exceptional $111,689 |
| Immigrants | Hungary | 98.8 /100 | #84 | Exceptional $111,378 |
| Croatians | 98.8 /100 | #85 | Exceptional $111,370 |
| Ukrainians | 98.8 /100 | #86 | Exceptional $111,368 |
| Austrians | 98.8 /100 | #87 | Exceptional $111,306 |
| Romanians | 98.8 /100 | #88 | Exceptional $111,243 |
| Immigrants | Argentina | 98.5 /100 | #89 | Exceptional $110,873 |
| Northern Europeans | 98.3 /100 | #90 | Exceptional $110,635 |
| Immigrants | Southern Europe | 98.3 /100 | #91 | Exceptional $110,614 |
| Immigrants | Lebanon | 97.9 /100 | #92 | Exceptional $110,159 |
| Immigrants | Kazakhstan | 97.8 /100 | #93 | Exceptional $110,137 |
| Koreans | 97.8 /100 | #94 | Exceptional $110,103 |
| Zimbabweans | 97.7 /100 | #95 | Exceptional $110,011 |