English vs Salvadoran Married-couple Households
COMPARE
English
Salvadoran
Married-couple Households
Married-couple Households Comparison
English
Salvadorans
49.6%
MARRIED-COUPLE HOUSEHOLDS
99.9/ 100
METRIC RATING
18th/ 347
METRIC RANK
44.7%
MARRIED-COUPLE HOUSEHOLDS
1.9/ 100
METRIC RATING
227th/ 347
METRIC RANK
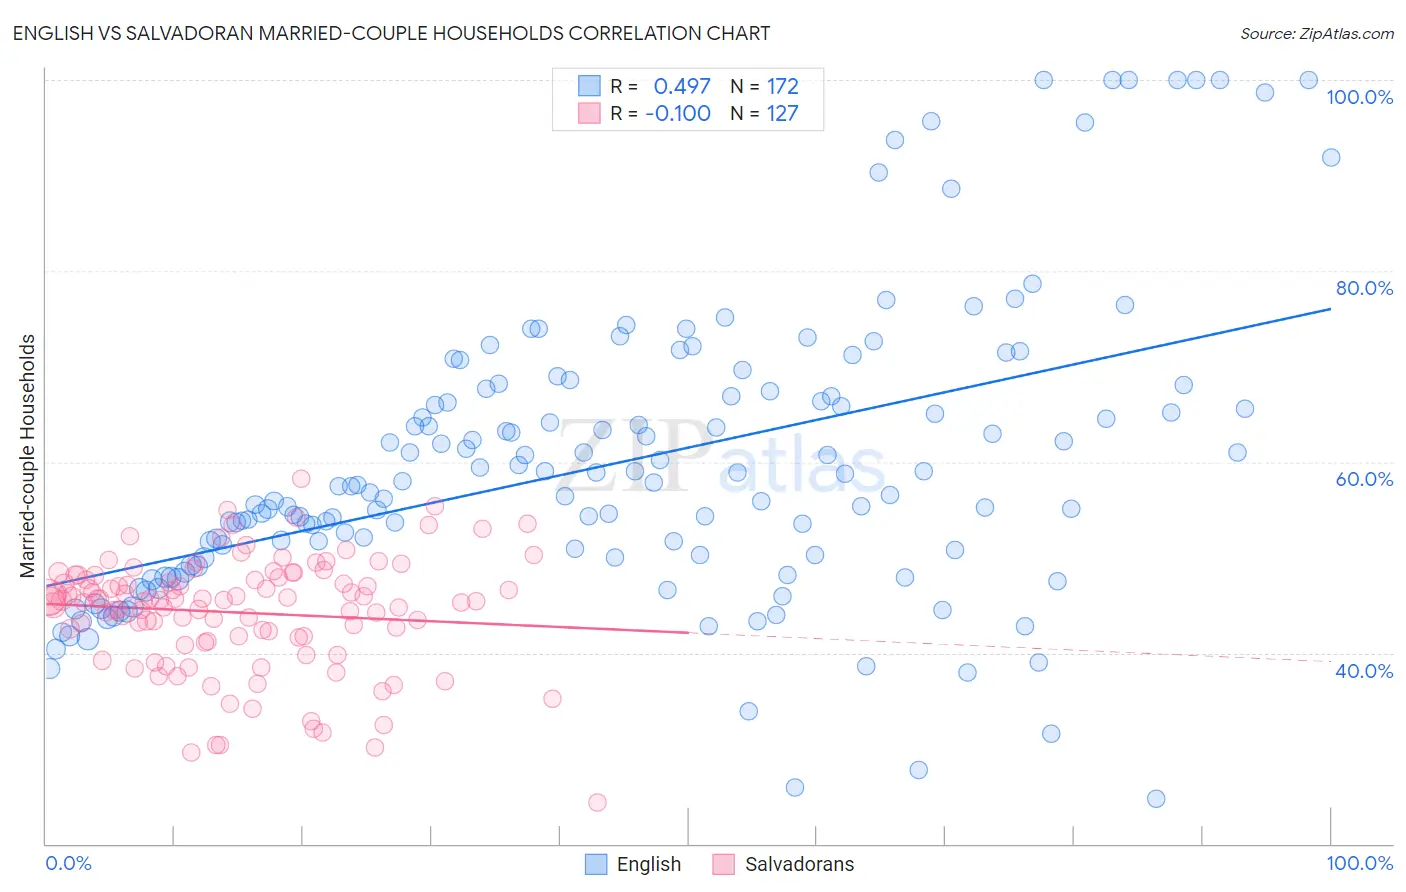
English vs Salvadoran Married-couple Households Correlation Chart
The statistical analysis conducted on geographies consisting of 579,267,782 people shows a moderate positive correlation between the proportion of English and percentage of married-couple family households in the United States with a correlation coefficient (R) of 0.497 and weighted average of 49.6%. Similarly, the statistical analysis conducted on geographies consisting of 398,667,012 people shows a poor negative correlation between the proportion of Salvadorans and percentage of married-couple family households in the United States with a correlation coefficient (R) of -0.100 and weighted average of 44.7%, a difference of 11.0%.
Married-couple Households Correlation Summary
| Measurement | English | Salvadoran |
| Minimum | 24.7% | 24.4% |
| Maximum | 100.0% | 58.2% |
| Range | 75.3% | 33.9% |
| Mean | 59.7% | 44.2% |
| Median | 57.5% | 45.5% |
| Interquartile 25% (IQ1) | 50.0% | 41.6% |
| Interquartile 75% (IQ3) | 66.9% | 47.9% |
| Interquartile Range (IQR) | 16.9% | 6.3% |
| Standard Deviation (Sample) | 15.3% | 6.0% |
| Standard Deviation (Population) | 15.3% | 5.9% |
Similar Demographics by Married-couple Households
Demographics Similar to English by Married-couple Households
In terms of married-couple households, the demographic groups most similar to English are Immigrants from Hong Kong (49.6%, a difference of 0.010%), Swedish (49.7%, a difference of 0.16%), European (49.6%, a difference of 0.16%), Scandinavian (49.6%, a difference of 0.17%), and Korean (49.7%, a difference of 0.19%).
| Demographics | Rating | Rank | Married-couple Households |
| Immigrants | Pakistan | 100.0 /100 | #11 | Exceptional 50.1% |
| Swiss | 100.0 /100 | #12 | Exceptional 49.9% |
| Immigrants | Korea | 100.0 /100 | #13 | Exceptional 49.9% |
| Burmese | 100.0 /100 | #14 | Exceptional 49.8% |
| Koreans | 99.9 /100 | #15 | Exceptional 49.7% |
| Swedes | 99.9 /100 | #16 | Exceptional 49.7% |
| Immigrants | Hong Kong | 99.9 /100 | #17 | Exceptional 49.6% |
| English | 99.9 /100 | #18 | Exceptional 49.6% |
| Europeans | 99.9 /100 | #19 | Exceptional 49.6% |
| Scandinavians | 99.9 /100 | #20 | Exceptional 49.6% |
| Norwegians | 99.9 /100 | #21 | Exceptional 49.5% |
| Asians | 99.9 /100 | #22 | Exceptional 49.5% |
| Dutch | 99.9 /100 | #23 | Exceptional 49.5% |
| Czechs | 99.9 /100 | #24 | Exceptional 49.4% |
| Immigrants | Philippines | 99.9 /100 | #25 | Exceptional 49.3% |
Demographics Similar to Salvadorans by Married-couple Households
In terms of married-couple households, the demographic groups most similar to Salvadorans are Kenyan (44.7%, a difference of 0.13%), Immigrants from Latin America (44.7%, a difference of 0.18%), Alsatian (44.8%, a difference of 0.19%), Soviet Union (44.6%, a difference of 0.22%), and Houma (44.6%, a difference of 0.22%).
| Demographics | Rating | Rank | Married-couple Households |
| Immigrants | Thailand | 5.1 /100 | #220 | Tragic 45.2% |
| Tlingit-Haida | 4.9 /100 | #221 | Tragic 45.1% |
| Immigrants | Laos | 4.6 /100 | #222 | Tragic 45.1% |
| Immigrants | Cambodia | 2.7 /100 | #223 | Tragic 44.9% |
| Immigrants | Micronesia | 2.6 /100 | #224 | Tragic 44.9% |
| Dutch West Indians | 2.6 /100 | #225 | Tragic 44.9% |
| Alsatians | 2.3 /100 | #226 | Tragic 44.8% |
| Salvadorans | 1.9 /100 | #227 | Tragic 44.7% |
| Kenyans | 1.7 /100 | #228 | Tragic 44.7% |
| Immigrants | Latin America | 1.6 /100 | #229 | Tragic 44.7% |
| Soviet Union | 1.6 /100 | #230 | Tragic 44.6% |
| Houma | 1.5 /100 | #231 | Tragic 44.6% |
| Marshallese | 1.5 /100 | #232 | Tragic 44.6% |
| Immigrants | Uganda | 1.5 /100 | #233 | Tragic 44.6% |
| Immigrants | Panama | 1.3 /100 | #234 | Tragic 44.6% |