English vs Tohono O'odham Average Family Size
COMPARE
English
Tohono O'odham
Average Family Size
Average Family Size Comparison
English
Tohono O'odham
3.11
AVERAGE FAMILY SIZE
0.0/ 100
METRIC RATING
325th/ 347
METRIC RANK
3.53
AVERAGE FAMILY SIZE
100.0/ 100
METRIC RATING
11th/ 347
METRIC RANK
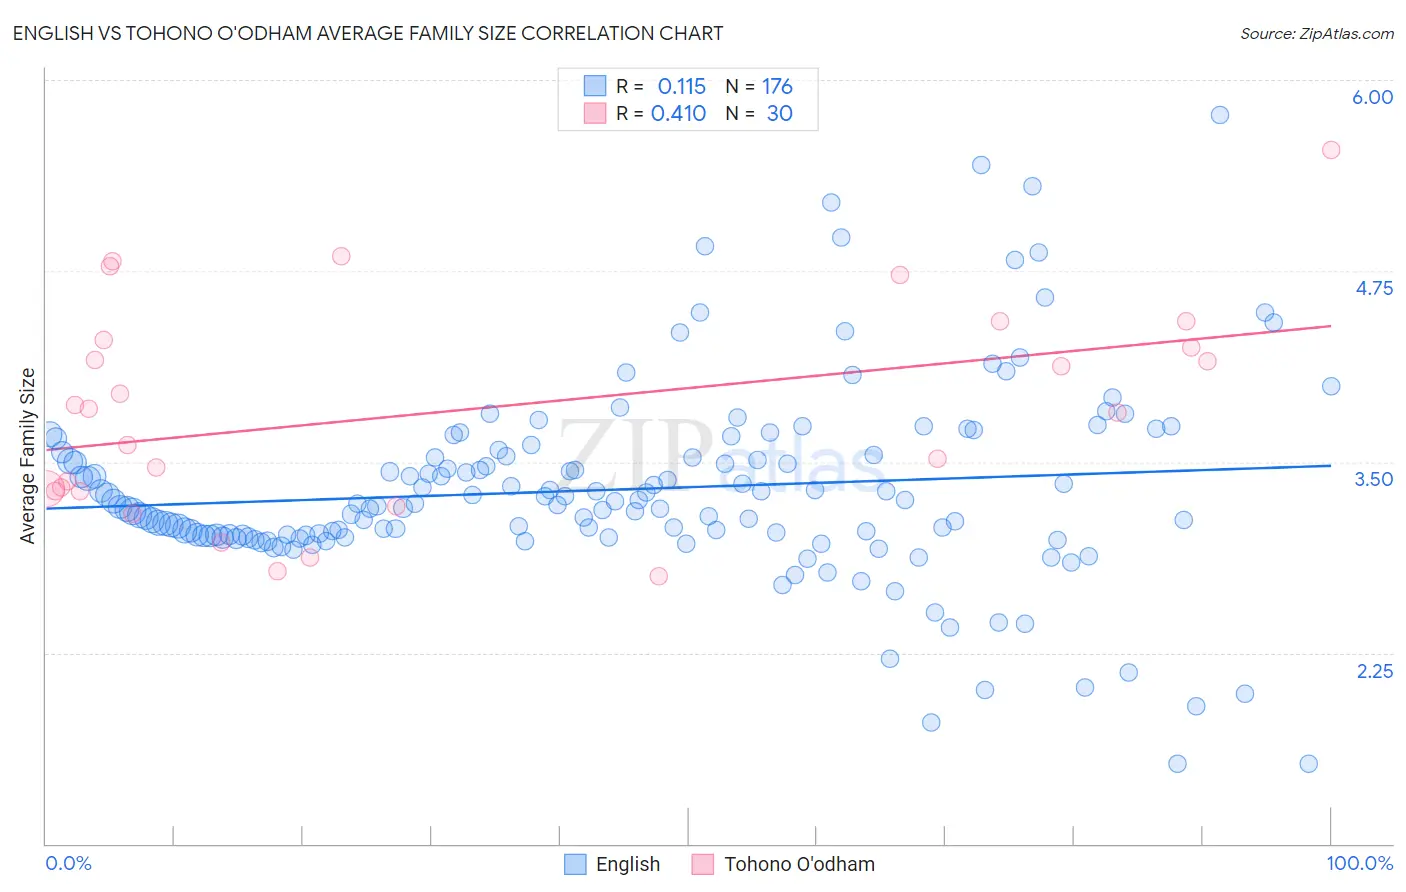
English vs Tohono O'odham Average Family Size Correlation Chart
The statistical analysis conducted on geographies consisting of 579,316,351 people shows a poor positive correlation between the proportion of English and average family size in the United States with a correlation coefficient (R) of 0.115 and weighted average of 3.11. Similarly, the statistical analysis conducted on geographies consisting of 58,718,905 people shows a moderate positive correlation between the proportion of Tohono O'odham and average family size in the United States with a correlation coefficient (R) of 0.410 and weighted average of 3.53, a difference of 13.6%.
Average Family Size Correlation Summary
| Measurement | English | Tohono O'odham |
| Minimum | 1.52 | 2.75 |
| Maximum | 5.77 | 5.54 |
| Range | 4.25 | 2.79 |
| Mean | 3.32 | 3.83 |
| Median | 3.22 | 3.84 |
| Interquartile 25% (IQ1) | 3.02 | 3.31 |
| Interquartile 75% (IQ3) | 3.54 | 4.30 |
| Interquartile Range (IQR) | 0.52 | 0.99 |
| Standard Deviation (Sample) | 0.64 | 0.70 |
| Standard Deviation (Population) | 0.64 | 0.69 |
Similar Demographics by Average Family Size
Demographics Similar to English by Average Family Size
In terms of average family size, the demographic groups most similar to English are Celtic (3.11, a difference of 0.040%), Ottawa (3.11, a difference of 0.050%), Dutch (3.11, a difference of 0.060%), Czech (3.11, a difference of 0.060%), and Soviet Union (3.11, a difference of 0.12%).
| Demographics | Rating | Rank | Average Family Size |
| Eastern Europeans | 0.1 /100 | #318 | Tragic 3.12 |
| Welsh | 0.1 /100 | #319 | Tragic 3.12 |
| Immigrants | North America | 0.0 /100 | #320 | Tragic 3.12 |
| Immigrants | Austria | 0.0 /100 | #321 | Tragic 3.12 |
| Immigrants | Canada | 0.0 /100 | #322 | Tragic 3.12 |
| Soviet Union | 0.0 /100 | #323 | Tragic 3.11 |
| Celtics | 0.0 /100 | #324 | Tragic 3.11 |
| English | 0.0 /100 | #325 | Tragic 3.11 |
| Ottawa | 0.0 /100 | #326 | Tragic 3.11 |
| Dutch | 0.0 /100 | #327 | Tragic 3.11 |
| Czechs | 0.0 /100 | #328 | Tragic 3.11 |
| Belgians | 0.0 /100 | #329 | Tragic 3.11 |
| Latvians | 0.0 /100 | #330 | Tragic 3.11 |
| Scotch-Irish | 0.0 /100 | #331 | Tragic 3.11 |
| Scottish | 0.0 /100 | #332 | Tragic 3.11 |
Demographics Similar to Tohono O'odham by Average Family Size
In terms of average family size, the demographic groups most similar to Tohono O'odham are Immigrants from Mexico (3.52, a difference of 0.42%), Sioux (3.52, a difference of 0.50%), Immigrants from Central America (3.49, a difference of 1.1%), Tongan (3.49, a difference of 1.2%), and Ute (3.49, a difference of 1.2%).
| Demographics | Rating | Rank | Average Family Size |
| Pima | 100 /100 | #4 | Exceptional 3.75 |
| Navajo | 100.0 /100 | #5 | Exceptional 3.65 |
| Arapaho | 100.0 /100 | #6 | Exceptional 3.64 |
| Inupiat | 100.0 /100 | #7 | Exceptional 3.63 |
| Immigrants | Yemen | 100.0 /100 | #8 | Exceptional 3.60 |
| Hopi | 100.0 /100 | #9 | Exceptional 3.60 |
| Spanish American Indians | 100.0 /100 | #10 | Exceptional 3.58 |
| Tohono O'odham | 100.0 /100 | #11 | Exceptional 3.53 |
| Immigrants | Mexico | 100.0 /100 | #12 | Exceptional 3.52 |
| Sioux | 100.0 /100 | #13 | Exceptional 3.52 |
| Immigrants | Central America | 100.0 /100 | #14 | Exceptional 3.49 |
| Tongans | 100.0 /100 | #15 | Exceptional 3.49 |
| Ute | 100.0 /100 | #16 | Exceptional 3.49 |
| Immigrants | El Salvador | 100.0 /100 | #17 | Exceptional 3.49 |
| Salvadorans | 100.0 /100 | #18 | Exceptional 3.48 |