English vs Yakama Average Family Size
COMPARE
English
Yakama
Average Family Size
Average Family Size Comparison
English
Yakama
3.11
AVERAGE FAMILY SIZE
0.0/ 100
METRIC RATING
325th/ 347
METRIC RANK
3.45
AVERAGE FAMILY SIZE
100.0/ 100
METRIC RATING
25th/ 347
METRIC RANK
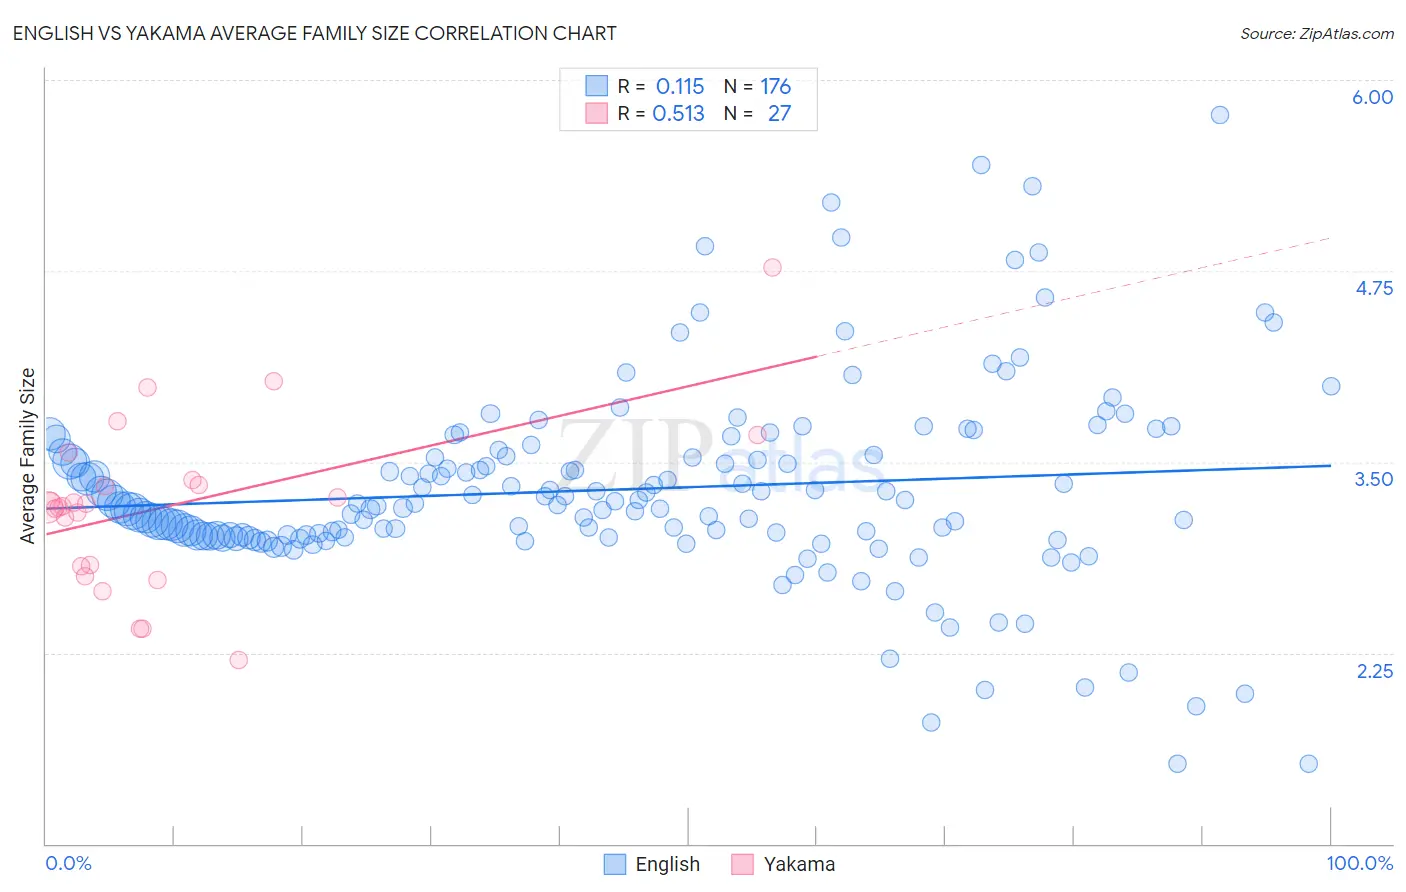
English vs Yakama Average Family Size Correlation Chart
The statistical analysis conducted on geographies consisting of 579,316,351 people shows a poor positive correlation between the proportion of English and average family size in the United States with a correlation coefficient (R) of 0.115 and weighted average of 3.11. Similarly, the statistical analysis conducted on geographies consisting of 19,917,879 people shows a substantial positive correlation between the proportion of Yakama and average family size in the United States with a correlation coefficient (R) of 0.513 and weighted average of 3.45, a difference of 10.8%.
Average Family Size Correlation Summary
| Measurement | English | Yakama |
| Minimum | 1.52 | 2.20 |
| Maximum | 5.77 | 4.77 |
| Range | 4.25 | 2.57 |
| Mean | 3.32 | 3.21 |
| Median | 3.22 | 3.21 |
| Interquartile 25% (IQ1) | 3.02 | 2.82 |
| Interquartile 75% (IQ3) | 3.54 | 3.38 |
| Interquartile Range (IQR) | 0.52 | 0.56 |
| Standard Deviation (Sample) | 0.64 | 0.55 |
| Standard Deviation (Population) | 0.64 | 0.54 |
Similar Demographics by Average Family Size
Demographics Similar to English by Average Family Size
In terms of average family size, the demographic groups most similar to English are Celtic (3.11, a difference of 0.040%), Ottawa (3.11, a difference of 0.050%), Dutch (3.11, a difference of 0.060%), Czech (3.11, a difference of 0.060%), and Soviet Union (3.11, a difference of 0.12%).
| Demographics | Rating | Rank | Average Family Size |
| Eastern Europeans | 0.1 /100 | #318 | Tragic 3.12 |
| Welsh | 0.1 /100 | #319 | Tragic 3.12 |
| Immigrants | North America | 0.0 /100 | #320 | Tragic 3.12 |
| Immigrants | Austria | 0.0 /100 | #321 | Tragic 3.12 |
| Immigrants | Canada | 0.0 /100 | #322 | Tragic 3.12 |
| Soviet Union | 0.0 /100 | #323 | Tragic 3.11 |
| Celtics | 0.0 /100 | #324 | Tragic 3.11 |
| English | 0.0 /100 | #325 | Tragic 3.11 |
| Ottawa | 0.0 /100 | #326 | Tragic 3.11 |
| Dutch | 0.0 /100 | #327 | Tragic 3.11 |
| Czechs | 0.0 /100 | #328 | Tragic 3.11 |
| Belgians | 0.0 /100 | #329 | Tragic 3.11 |
| Latvians | 0.0 /100 | #330 | Tragic 3.11 |
| Scotch-Irish | 0.0 /100 | #331 | Tragic 3.11 |
| Scottish | 0.0 /100 | #332 | Tragic 3.11 |
Demographics Similar to Yakama by Average Family Size
In terms of average family size, the demographic groups most similar to Yakama are Native/Alaskan (3.45, a difference of 0.11%), Immigrants from Fiji (3.45, a difference of 0.23%), Native Hawaiian (3.43, a difference of 0.51%), Apache (3.46, a difference of 0.52%), and Mexican American Indian (3.43, a difference of 0.52%).
| Demographics | Rating | Rank | Average Family Size |
| Salvadorans | 100.0 /100 | #18 | Exceptional 3.48 |
| Mexicans | 100.0 /100 | #19 | Exceptional 3.48 |
| Cheyenne | 100.0 /100 | #20 | Exceptional 3.47 |
| Yuman | 100.0 /100 | #21 | Exceptional 3.47 |
| Apache | 100.0 /100 | #22 | Exceptional 3.46 |
| Immigrants | Fiji | 100.0 /100 | #23 | Exceptional 3.45 |
| Natives/Alaskans | 100.0 /100 | #24 | Exceptional 3.45 |
| Yakama | 100.0 /100 | #25 | Exceptional 3.45 |
| Native Hawaiians | 100.0 /100 | #26 | Exceptional 3.43 |
| Mexican American Indians | 100.0 /100 | #27 | Exceptional 3.43 |
| Immigrants | Latin America | 100.0 /100 | #28 | Exceptional 3.42 |
| Nepalese | 100.0 /100 | #29 | Exceptional 3.42 |
| Samoans | 100.0 /100 | #30 | Exceptional 3.42 |
| Central Americans | 100.0 /100 | #31 | Exceptional 3.41 |
| Immigrants | Guatemala | 100.0 /100 | #32 | Exceptional 3.41 |