English vs Swedish Average Family Size
COMPARE
English
Swedish
Average Family Size
Average Family Size Comparison
English
Swedes
3.11
AVERAGE FAMILY SIZE
0.0/ 100
METRIC RATING
325th/ 347
METRIC RANK
3.10
AVERAGE FAMILY SIZE
0.0/ 100
METRIC RATING
337th/ 347
METRIC RANK
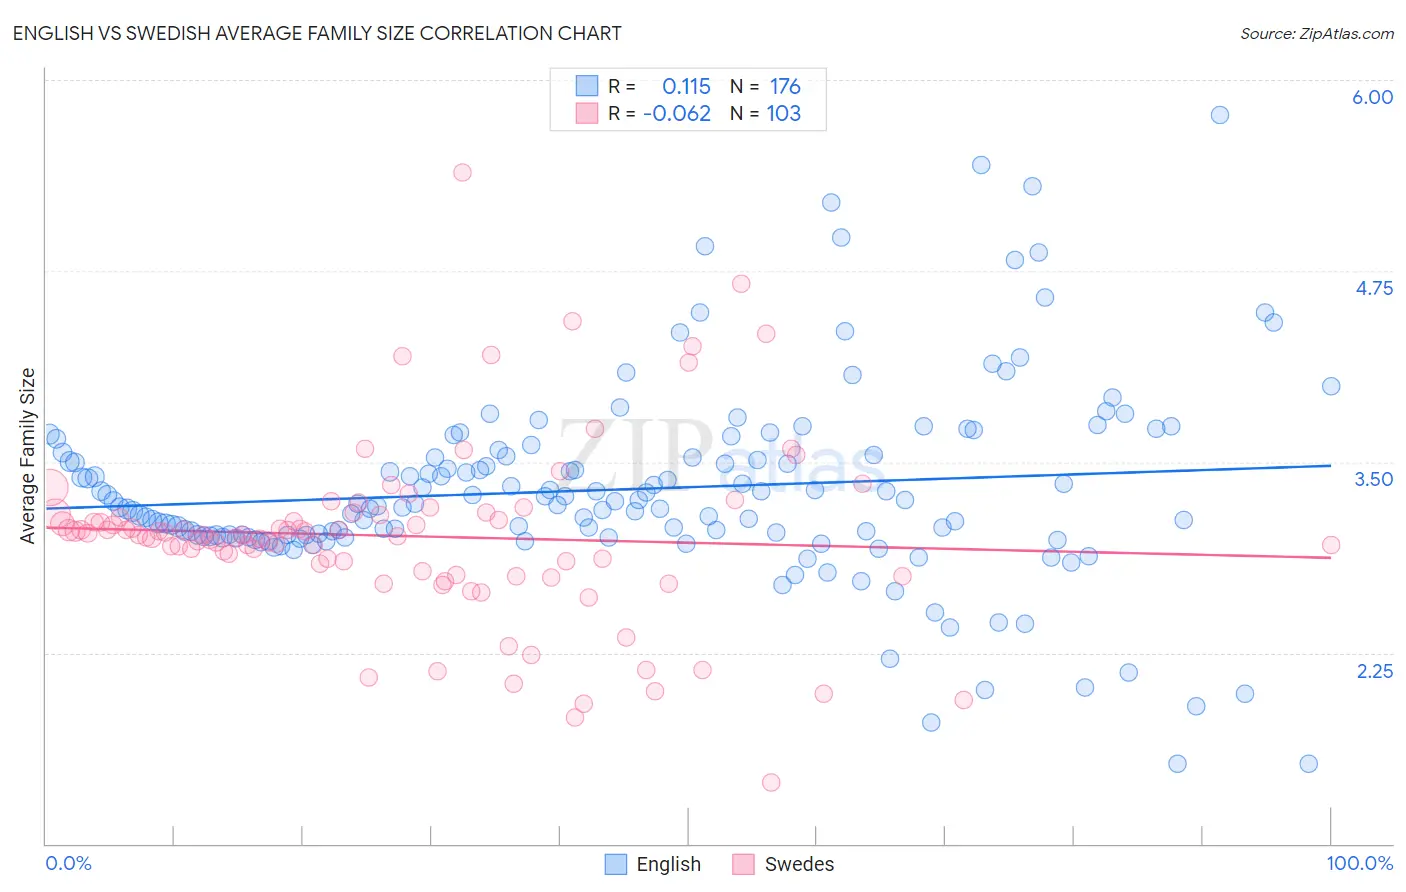
English vs Swedish Average Family Size Correlation Chart
The statistical analysis conducted on geographies consisting of 579,316,351 people shows a poor positive correlation between the proportion of English and average family size in the United States with a correlation coefficient (R) of 0.115 and weighted average of 3.11. Similarly, the statistical analysis conducted on geographies consisting of 538,762,324 people shows a slight negative correlation between the proportion of Swedes and average family size in the United States with a correlation coefficient (R) of -0.062 and weighted average of 3.10, a difference of 0.36%.
Average Family Size Correlation Summary
| Measurement | English | Swedish |
| Minimum | 1.52 | 1.40 |
| Maximum | 5.77 | 5.39 |
| Range | 4.25 | 3.99 |
| Mean | 3.32 | 3.01 |
| Median | 3.22 | 3.02 |
| Interquartile 25% (IQ1) | 3.02 | 2.79 |
| Interquartile 75% (IQ3) | 3.54 | 3.16 |
| Interquartile Range (IQR) | 0.52 | 0.37 |
| Standard Deviation (Sample) | 0.64 | 0.59 |
| Standard Deviation (Population) | 0.64 | 0.59 |
Demographics Similar to English and Swedes by Average Family Size
In terms of average family size, the demographic groups most similar to English are Celtic (3.11, a difference of 0.040%), Ottawa (3.11, a difference of 0.050%), Dutch (3.11, a difference of 0.060%), Czech (3.11, a difference of 0.060%), and Soviet Union (3.11, a difference of 0.12%). Similarly, the demographic groups most similar to Swedes are French (3.10, a difference of 0.020%), Irish (3.10, a difference of 0.030%), Croatian (3.10, a difference of 0.030%), Luxembourger (3.10, a difference of 0.090%), and Lithuanian (3.10, a difference of 0.12%).
| Demographics | Rating | Rank | Average Family Size |
| Immigrants | Austria | 0.0 /100 | #321 | Tragic 3.12 |
| Immigrants | Canada | 0.0 /100 | #322 | Tragic 3.12 |
| Soviet Union | 0.0 /100 | #323 | Tragic 3.11 |
| Celtics | 0.0 /100 | #324 | Tragic 3.11 |
| English | 0.0 /100 | #325 | Tragic 3.11 |
| Ottawa | 0.0 /100 | #326 | Tragic 3.11 |
| Dutch | 0.0 /100 | #327 | Tragic 3.11 |
| Czechs | 0.0 /100 | #328 | Tragic 3.11 |
| Belgians | 0.0 /100 | #329 | Tragic 3.11 |
| Latvians | 0.0 /100 | #330 | Tragic 3.11 |
| Scotch-Irish | 0.0 /100 | #331 | Tragic 3.11 |
| Scottish | 0.0 /100 | #332 | Tragic 3.11 |
| Estonians | 0.0 /100 | #333 | Tragic 3.10 |
| Lithuanians | 0.0 /100 | #334 | Tragic 3.10 |
| Luxembourgers | 0.0 /100 | #335 | Tragic 3.10 |
| Irish | 0.0 /100 | #336 | Tragic 3.10 |
| Swedes | 0.0 /100 | #337 | Tragic 3.10 |
| French | 0.0 /100 | #338 | Tragic 3.10 |
| Croatians | 0.0 /100 | #339 | Tragic 3.10 |
| Finns | 0.0 /100 | #340 | Tragic 3.09 |
| Poles | 0.0 /100 | #341 | Tragic 3.09 |