English vs Immigrants from Croatia Average Family Size
COMPARE
English
Immigrants from Croatia
Average Family Size
Average Family Size Comparison
English
Immigrants from Croatia
3.11
AVERAGE FAMILY SIZE
0.0/ 100
METRIC RATING
325th/ 347
METRIC RANK
3.14
AVERAGE FAMILY SIZE
0.2/ 100
METRIC RATING
294th/ 347
METRIC RANK
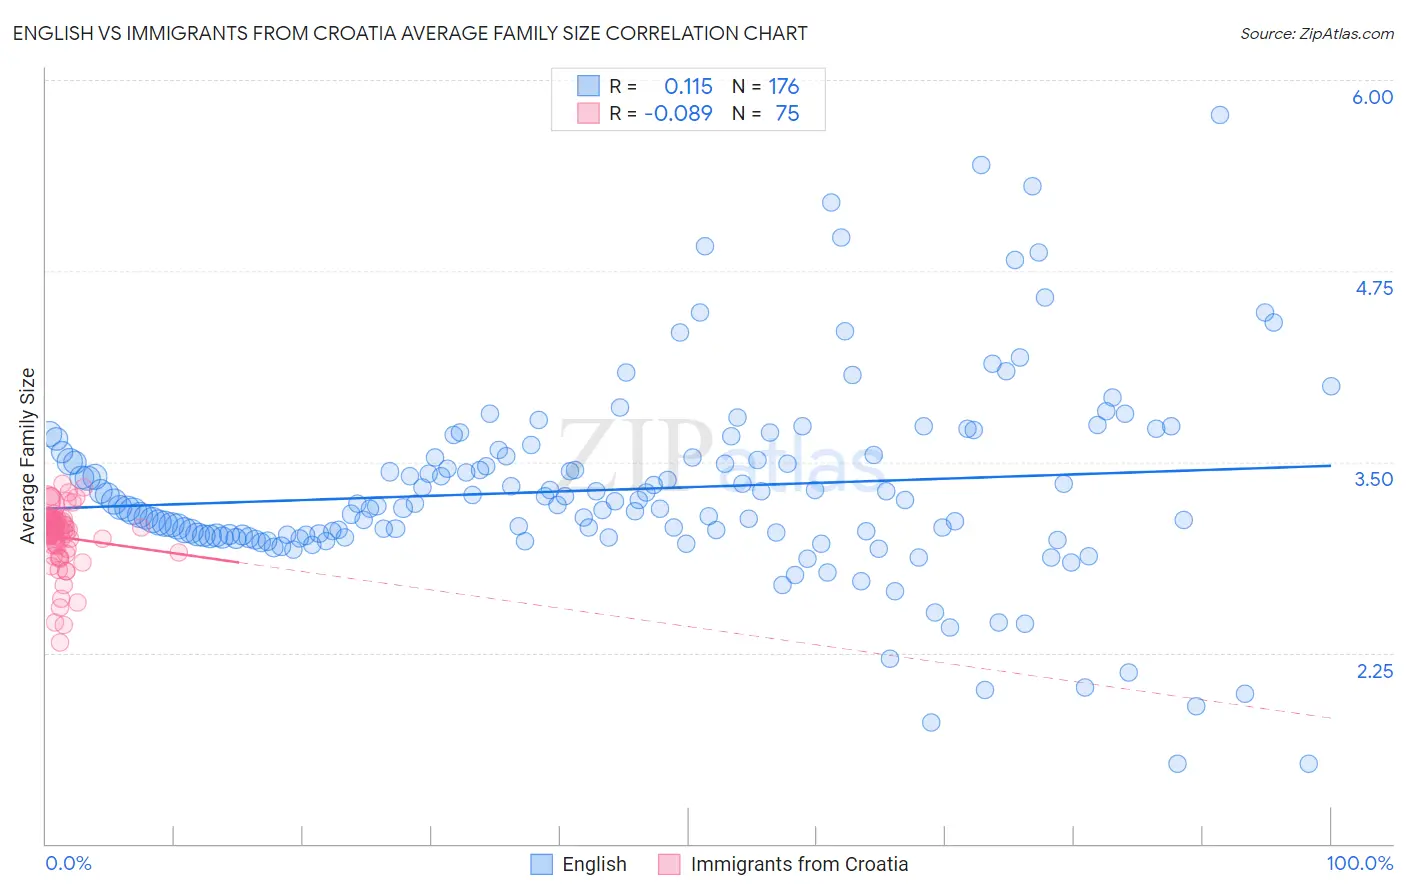
English vs Immigrants from Croatia Average Family Size Correlation Chart
The statistical analysis conducted on geographies consisting of 579,316,351 people shows a poor positive correlation between the proportion of English and average family size in the United States with a correlation coefficient (R) of 0.115 and weighted average of 3.11. Similarly, the statistical analysis conducted on geographies consisting of 132,563,359 people shows a slight negative correlation between the proportion of Immigrants from Croatia and average family size in the United States with a correlation coefficient (R) of -0.089 and weighted average of 3.14, a difference of 0.89%.
Average Family Size Correlation Summary
| Measurement | English | Immigrants from Croatia |
| Minimum | 1.52 | 2.32 |
| Maximum | 5.77 | 3.36 |
| Range | 4.25 | 1.04 |
| Mean | 3.32 | 3.01 |
| Median | 3.22 | 3.05 |
| Interquartile 25% (IQ1) | 3.02 | 2.93 |
| Interquartile 75% (IQ3) | 3.54 | 3.13 |
| Interquartile Range (IQR) | 0.52 | 0.20 |
| Standard Deviation (Sample) | 0.64 | 0.20 |
| Standard Deviation (Population) | 0.64 | 0.20 |
Similar Demographics by Average Family Size
Demographics Similar to English by Average Family Size
In terms of average family size, the demographic groups most similar to English are Celtic (3.11, a difference of 0.040%), Ottawa (3.11, a difference of 0.050%), Dutch (3.11, a difference of 0.060%), Czech (3.11, a difference of 0.060%), and Soviet Union (3.11, a difference of 0.12%).
| Demographics | Rating | Rank | Average Family Size |
| Eastern Europeans | 0.1 /100 | #318 | Tragic 3.12 |
| Welsh | 0.1 /100 | #319 | Tragic 3.12 |
| Immigrants | North America | 0.0 /100 | #320 | Tragic 3.12 |
| Immigrants | Austria | 0.0 /100 | #321 | Tragic 3.12 |
| Immigrants | Canada | 0.0 /100 | #322 | Tragic 3.12 |
| Soviet Union | 0.0 /100 | #323 | Tragic 3.11 |
| Celtics | 0.0 /100 | #324 | Tragic 3.11 |
| English | 0.0 /100 | #325 | Tragic 3.11 |
| Ottawa | 0.0 /100 | #326 | Tragic 3.11 |
| Dutch | 0.0 /100 | #327 | Tragic 3.11 |
| Czechs | 0.0 /100 | #328 | Tragic 3.11 |
| Belgians | 0.0 /100 | #329 | Tragic 3.11 |
| Latvians | 0.0 /100 | #330 | Tragic 3.11 |
| Scotch-Irish | 0.0 /100 | #331 | Tragic 3.11 |
| Scottish | 0.0 /100 | #332 | Tragic 3.11 |
Demographics Similar to Immigrants from Croatia by Average Family Size
In terms of average family size, the demographic groups most similar to Immigrants from Croatia are Austrian (3.14, a difference of 0.010%), Ukrainian (3.14, a difference of 0.010%), Immigrants from Western Europe (3.14, a difference of 0.010%), Colville (3.14, a difference of 0.010%), and Scandinavian (3.14, a difference of 0.020%).
| Demographics | Rating | Rank | Average Family Size |
| Greeks | 0.3 /100 | #287 | Tragic 3.14 |
| Immigrants | Czechoslovakia | 0.3 /100 | #288 | Tragic 3.14 |
| Immigrants | Norway | 0.3 /100 | #289 | Tragic 3.14 |
| Cypriots | 0.3 /100 | #290 | Tragic 3.14 |
| Alsatians | 0.2 /100 | #291 | Tragic 3.14 |
| Europeans | 0.2 /100 | #292 | Tragic 3.14 |
| Scandinavians | 0.2 /100 | #293 | Tragic 3.14 |
| Immigrants | Croatia | 0.2 /100 | #294 | Tragic 3.14 |
| Austrians | 0.2 /100 | #295 | Tragic 3.14 |
| Ukrainians | 0.2 /100 | #296 | Tragic 3.14 |
| Immigrants | Western Europe | 0.2 /100 | #297 | Tragic 3.14 |
| Colville | 0.2 /100 | #298 | Tragic 3.14 |
| Canadians | 0.2 /100 | #299 | Tragic 3.14 |
| Immigrants | Sweden | 0.2 /100 | #300 | Tragic 3.14 |
| Macedonians | 0.2 /100 | #301 | Tragic 3.13 |