Dominican vs Afghan Currently Married
COMPARE
Dominican
Afghan
Currently Married
Currently Married Comparison
Dominicans
Afghans
39.5%
CURRENTLY MARRIED
0.0/ 100
METRIC RATING
339th/ 347
METRIC RANK
47.3%
CURRENTLY MARRIED
81.8/ 100
METRIC RATING
132nd/ 347
METRIC RANK
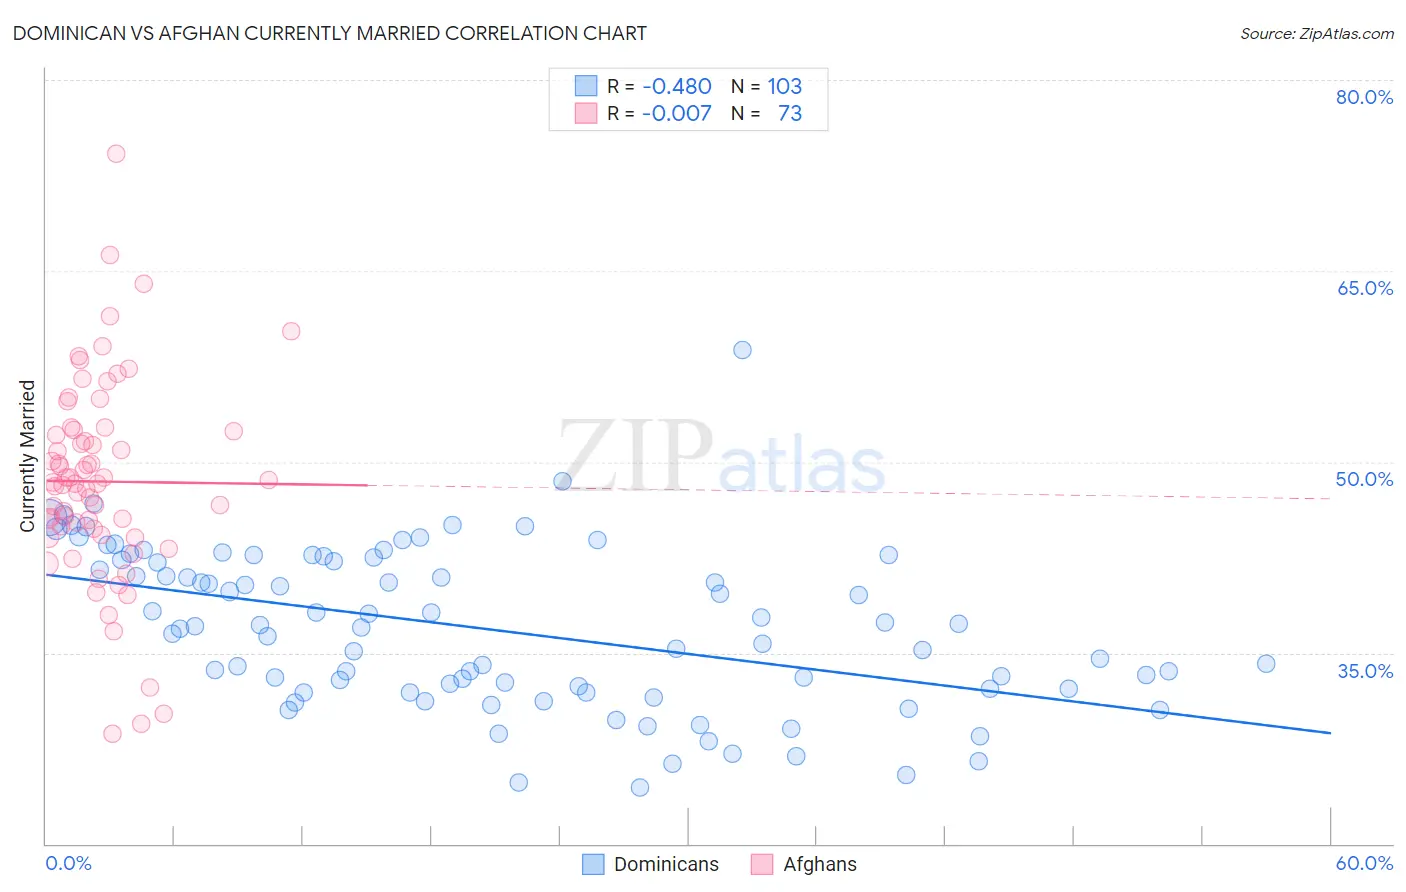
Dominican vs Afghan Currently Married Correlation Chart
The statistical analysis conducted on geographies consisting of 355,078,950 people shows a moderate negative correlation between the proportion of Dominicans and percentage of population currently married in the United States with a correlation coefficient (R) of -0.480 and weighted average of 39.5%. Similarly, the statistical analysis conducted on geographies consisting of 148,861,336 people shows no correlation between the proportion of Afghans and percentage of population currently married in the United States with a correlation coefficient (R) of -0.007 and weighted average of 47.3%, a difference of 19.6%.
Currently Married Correlation Summary
| Measurement | Dominican | Afghan |
| Minimum | 24.4% | 28.6% |
| Maximum | 58.8% | 74.2% |
| Range | 34.4% | 45.6% |
| Mean | 36.9% | 48.5% |
| Median | 37.0% | 48.3% |
| Interquartile 25% (IQ1) | 32.2% | 44.5% |
| Interquartile 75% (IQ3) | 42.3% | 52.5% |
| Interquartile Range (IQR) | 10.1% | 8.0% |
| Standard Deviation (Sample) | 6.3% | 8.0% |
| Standard Deviation (Population) | 6.2% | 7.9% |
Similar Demographics by Currently Married
Demographics Similar to Dominicans by Currently Married
In terms of currently married, the demographic groups most similar to Dominicans are Cape Verdean (39.6%, a difference of 0.15%), Black/African American (39.6%, a difference of 0.25%), British West Indian (39.8%, a difference of 0.63%), Lumbee (39.8%, a difference of 0.80%), and Immigrants from Grenada (39.1%, a difference of 0.96%).
| Demographics | Rating | Rank | Currently Married |
| Immigrants | St. Vincent and the Grenadines | 0.0 /100 | #332 | Tragic 40.1% |
| Yup'ik | 0.0 /100 | #333 | Tragic 39.9% |
| Puerto Ricans | 0.0 /100 | #334 | Tragic 39.9% |
| Lumbee | 0.0 /100 | #335 | Tragic 39.8% |
| British West Indians | 0.0 /100 | #336 | Tragic 39.8% |
| Blacks/African Americans | 0.0 /100 | #337 | Tragic 39.6% |
| Cape Verdeans | 0.0 /100 | #338 | Tragic 39.6% |
| Dominicans | 0.0 /100 | #339 | Tragic 39.5% |
| Immigrants | Grenada | 0.0 /100 | #340 | Tragic 39.1% |
| Navajo | 0.0 /100 | #341 | Tragic 39.0% |
| Immigrants | Dominican Republic | 0.0 /100 | #342 | Tragic 38.9% |
| Pueblo | 0.0 /100 | #343 | Tragic 38.2% |
| Immigrants | Cabo Verde | 0.0 /100 | #344 | Tragic 37.8% |
| Tohono O'odham | 0.0 /100 | #345 | Tragic 36.8% |
| Hopi | 0.0 /100 | #346 | Tragic 36.5% |
Demographics Similar to Afghans by Currently Married
In terms of currently married, the demographic groups most similar to Afghans are Icelander (47.3%, a difference of 0.040%), Immigrants from Malaysia (47.3%, a difference of 0.040%), Immigrants from Australia (47.3%, a difference of 0.050%), Immigrants from Iraq (47.3%, a difference of 0.060%), and Sri Lankan (47.3%, a difference of 0.090%).
| Demographics | Rating | Rank | Currently Married |
| Okinawans | 85.3 /100 | #125 | Excellent 47.4% |
| Immigrants | Jordan | 84.9 /100 | #126 | Excellent 47.4% |
| New Zealanders | 84.9 /100 | #127 | Excellent 47.4% |
| Portuguese | 84.2 /100 | #128 | Excellent 47.3% |
| Sri Lankans | 83.2 /100 | #129 | Excellent 47.3% |
| Immigrants | Iraq | 82.8 /100 | #130 | Excellent 47.3% |
| Icelanders | 82.4 /100 | #131 | Excellent 47.3% |
| Afghans | 81.8 /100 | #132 | Excellent 47.3% |
| Immigrants | Malaysia | 81.1 /100 | #133 | Excellent 47.3% |
| Immigrants | Australia | 81.1 /100 | #134 | Excellent 47.3% |
| Immigrants | Norway | 79.7 /100 | #135 | Good 47.2% |
| Immigrants | Vietnam | 78.2 /100 | #136 | Good 47.2% |
| Paraguayans | 77.8 /100 | #137 | Good 47.2% |
| Pakistanis | 77.5 /100 | #138 | Good 47.2% |
| Yugoslavians | 77.4 /100 | #139 | Good 47.2% |