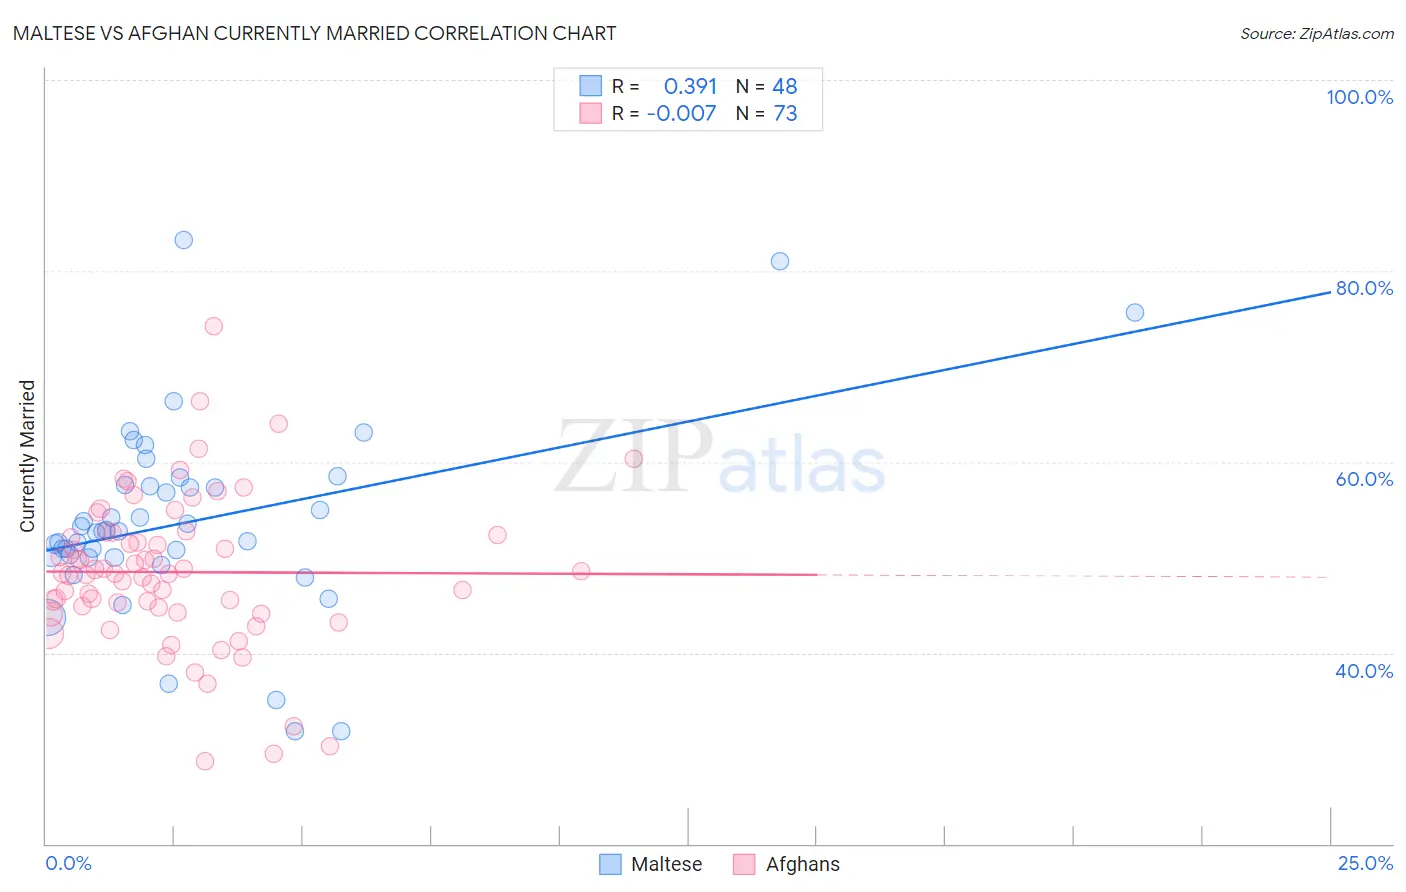
Maltese vs Afghan Currently Married
COMPARE
Maltese
Afghan
Currently Married
Currently Married Comparison
Maltese
Afghans
49.0%
CURRENTLY MARRIED
99.6/ 100
METRIC RATING
25th/ 347
METRIC RANK
47.3%
CURRENTLY MARRIED
81.8/ 100
METRIC RATING
132nd/ 347
METRIC RANK
Maltese vs Afghan Currently Married Correlation Chart
The statistical analysis conducted on geographies consisting of 126,466,050 people shows a mild positive correlation between the proportion of Maltese and percentage of population currently married in the United States with a correlation coefficient (R) of 0.391 and weighted average of 49.0%. Similarly, the statistical analysis conducted on geographies consisting of 148,861,336 people shows no correlation between the proportion of Afghans and percentage of population currently married in the United States with a correlation coefficient (R) of -0.007 and weighted average of 47.3%, a difference of 3.7%.
Currently Married Correlation Summary
| Measurement | Maltese | Afghan |
| Minimum | 31.8% | 28.6% |
| Maximum | 83.3% | 74.2% |
| Range | 51.5% | 45.6% |
| Mean | 53.8% | 48.5% |
| Median | 52.8% | 48.3% |
| Interquartile 25% (IQ1) | 50.0% | 44.5% |
| Interquartile 75% (IQ3) | 57.5% | 52.5% |
| Interquartile Range (IQR) | 7.5% | 8.0% |
| Standard Deviation (Sample) | 10.1% | 8.0% |
| Standard Deviation (Population) | 10.0% | 7.9% |
Similar Demographics by Currently Married
Demographics Similar to Maltese by Currently Married
In terms of currently married, the demographic groups most similar to Maltese are Lithuanian (49.0%, a difference of 0.010%), Immigrants from Korea (49.0%, a difference of 0.050%), Immigrants from Pakistan (49.1%, a difference of 0.12%), Burmese (48.9%, a difference of 0.12%), and Welsh (48.9%, a difference of 0.16%).
| Demographics | Rating | Rank | Currently Married |
| Immigrants | Scotland | 99.8 /100 | #18 | Exceptional 49.3% |
| Europeans | 99.8 /100 | #19 | Exceptional 49.3% |
| Luxembourgers | 99.8 /100 | #20 | Exceptional 49.3% |
| Scottish | 99.8 /100 | #21 | Exceptional 49.2% |
| Bulgarians | 99.7 /100 | #22 | Exceptional 49.1% |
| Immigrants | Pakistan | 99.7 /100 | #23 | Exceptional 49.1% |
| Lithuanians | 99.6 /100 | #24 | Exceptional 49.0% |
| Maltese | 99.6 /100 | #25 | Exceptional 49.0% |
| Immigrants | Korea | 99.6 /100 | #26 | Exceptional 49.0% |
| Burmese | 99.6 /100 | #27 | Exceptional 48.9% |
| Welsh | 99.5 /100 | #28 | Exceptional 48.9% |
| Croatians | 99.5 /100 | #29 | Exceptional 48.9% |
| Eastern Europeans | 99.5 /100 | #30 | Exceptional 48.9% |
| Poles | 99.5 /100 | #31 | Exceptional 48.9% |
| Immigrants | Hong Kong | 99.5 /100 | #32 | Exceptional 48.9% |
Demographics Similar to Afghans by Currently Married
In terms of currently married, the demographic groups most similar to Afghans are Icelander (47.3%, a difference of 0.040%), Immigrants from Malaysia (47.3%, a difference of 0.040%), Immigrants from Australia (47.3%, a difference of 0.050%), Immigrants from Iraq (47.3%, a difference of 0.060%), and Sri Lankan (47.3%, a difference of 0.090%).
| Demographics | Rating | Rank | Currently Married |
| Okinawans | 85.3 /100 | #125 | Excellent 47.4% |
| Immigrants | Jordan | 84.9 /100 | #126 | Excellent 47.4% |
| New Zealanders | 84.9 /100 | #127 | Excellent 47.4% |
| Portuguese | 84.2 /100 | #128 | Excellent 47.3% |
| Sri Lankans | 83.2 /100 | #129 | Excellent 47.3% |
| Immigrants | Iraq | 82.8 /100 | #130 | Excellent 47.3% |
| Icelanders | 82.4 /100 | #131 | Excellent 47.3% |
| Afghans | 81.8 /100 | #132 | Excellent 47.3% |
| Immigrants | Malaysia | 81.1 /100 | #133 | Excellent 47.3% |
| Immigrants | Australia | 81.1 /100 | #134 | Excellent 47.3% |
| Immigrants | Norway | 79.7 /100 | #135 | Good 47.2% |
| Immigrants | Vietnam | 78.2 /100 | #136 | Good 47.2% |
| Paraguayans | 77.8 /100 | #137 | Good 47.2% |
| Pakistanis | 77.5 /100 | #138 | Good 47.2% |
| Yugoslavians | 77.4 /100 | #139 | Good 47.2% |