Dominican vs Afghan Cognitive Disability
COMPARE
Dominican
Afghan
Cognitive Disability
Cognitive Disability Comparison
Dominicans
Afghans
18.7%
COGNITIVE DISABILITY
0.0/ 100
METRIC RATING
324th/ 347
METRIC RANK
17.3%
COGNITIVE DISABILITY
38.2/ 100
METRIC RATING
185th/ 347
METRIC RANK
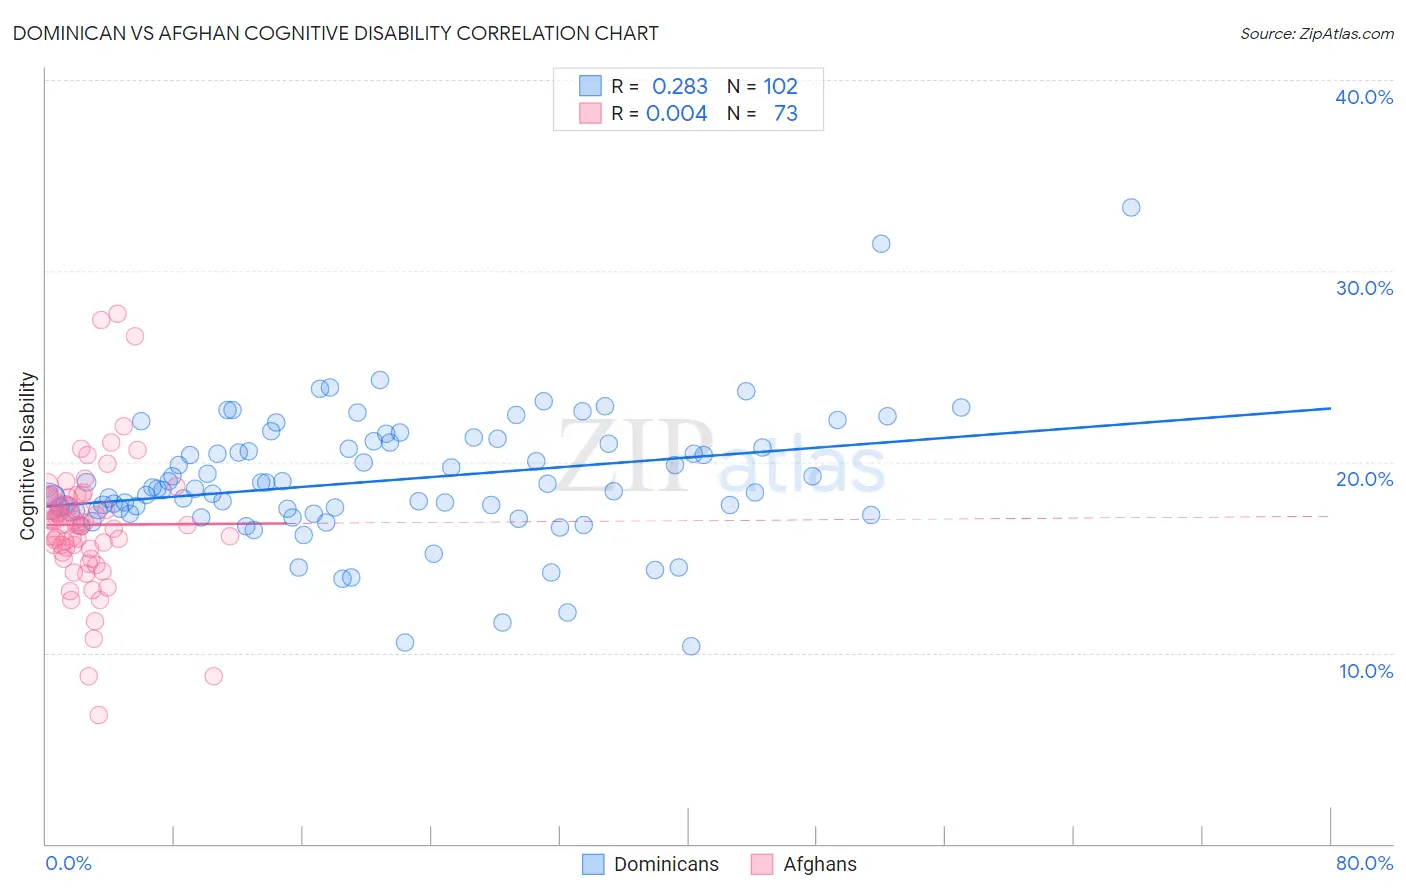
Dominican vs Afghan Cognitive Disability Correlation Chart
The statistical analysis conducted on geographies consisting of 355,056,669 people shows a weak positive correlation between the proportion of Dominicans and percentage of population with cognitive disability in the United States with a correlation coefficient (R) of 0.283 and weighted average of 18.7%. Similarly, the statistical analysis conducted on geographies consisting of 148,870,382 people shows no correlation between the proportion of Afghans and percentage of population with cognitive disability in the United States with a correlation coefficient (R) of 0.004 and weighted average of 17.3%, a difference of 7.7%.
Cognitive Disability Correlation Summary
| Measurement | Dominican | Afghan |
| Minimum | 10.3% | 6.7% |
| Maximum | 33.3% | 27.8% |
| Range | 23.0% | 21.0% |
| Mean | 19.0% | 16.7% |
| Median | 18.6% | 16.7% |
| Interquartile 25% (IQ1) | 17.4% | 15.3% |
| Interquartile 75% (IQ3) | 21.0% | 18.2% |
| Interquartile Range (IQR) | 3.6% | 2.9% |
| Standard Deviation (Sample) | 3.4% | 3.5% |
| Standard Deviation (Population) | 3.4% | 3.5% |
Similar Demographics by Cognitive Disability
Demographics Similar to Dominicans by Cognitive Disability
In terms of cognitive disability, the demographic groups most similar to Dominicans are Indonesian (18.7%, a difference of 0.080%), Immigrants from Senegal (18.7%, a difference of 0.10%), Pueblo (18.7%, a difference of 0.12%), Immigrants from Liberia (18.7%, a difference of 0.14%), and U.S. Virgin Islander (18.7%, a difference of 0.14%).
| Demographics | Rating | Rank | Cognitive Disability |
| Liberians | 0.0 /100 | #317 | Tragic 18.6% |
| Bangladeshis | 0.0 /100 | #318 | Tragic 18.6% |
| Comanche | 0.0 /100 | #319 | Tragic 18.6% |
| Apache | 0.0 /100 | #320 | Tragic 18.6% |
| Africans | 0.0 /100 | #321 | Tragic 18.6% |
| Immigrants | Liberia | 0.0 /100 | #322 | Tragic 18.7% |
| Pueblo | 0.0 /100 | #323 | Tragic 18.7% |
| Dominicans | 0.0 /100 | #324 | Tragic 18.7% |
| Indonesians | 0.0 /100 | #325 | Tragic 18.7% |
| Immigrants | Senegal | 0.0 /100 | #326 | Tragic 18.7% |
| U.S. Virgin Islanders | 0.0 /100 | #327 | Tragic 18.7% |
| Kiowa | 0.0 /100 | #328 | Tragic 18.7% |
| Navajo | 0.0 /100 | #329 | Tragic 18.8% |
| Immigrants | Dominican Republic | 0.0 /100 | #330 | Tragic 18.8% |
| Pima | 0.0 /100 | #331 | Tragic 18.8% |
Demographics Similar to Afghans by Cognitive Disability
In terms of cognitive disability, the demographic groups most similar to Afghans are Crow (17.3%, a difference of 0.030%), Spaniard (17.3%, a difference of 0.060%), Cambodian (17.3%, a difference of 0.070%), Immigrants from Guyana (17.3%, a difference of 0.14%), and Arab (17.3%, a difference of 0.14%).
| Demographics | Rating | Rank | Cognitive Disability |
| Spanish | 48.9 /100 | #178 | Average 17.3% |
| Sioux | 48.6 /100 | #179 | Average 17.3% |
| Pakistanis | 43.9 /100 | #180 | Average 17.3% |
| Immigrants | Guyana | 42.9 /100 | #181 | Average 17.3% |
| Arabs | 42.8 /100 | #182 | Average 17.3% |
| Spaniards | 40.3 /100 | #183 | Average 17.3% |
| Crow | 39.1 /100 | #184 | Fair 17.3% |
| Afghans | 38.2 /100 | #185 | Fair 17.3% |
| Cambodians | 35.9 /100 | #186 | Fair 17.3% |
| Immigrants | Fiji | 33.7 /100 | #187 | Fair 17.4% |
| Immigrants | France | 29.8 /100 | #188 | Fair 17.4% |
| Immigrants | Western Asia | 29.5 /100 | #189 | Fair 17.4% |
| Immigrants | Spain | 27.7 /100 | #190 | Fair 17.4% |
| Immigrants | Nonimmigrants | 27.4 /100 | #191 | Fair 17.4% |
| Immigrants | Haiti | 27.1 /100 | #192 | Fair 17.4% |