Immigrants from South Central Asia vs Afghan Currently Married
COMPARE
Immigrants from South Central Asia
Afghan
Currently Married
Currently Married Comparison
Immigrants from South Central Asia
Afghans
50.0%
CURRENTLY MARRIED
100.0/ 100
METRIC RATING
7th/ 347
METRIC RANK
47.3%
CURRENTLY MARRIED
81.8/ 100
METRIC RATING
132nd/ 347
METRIC RANK
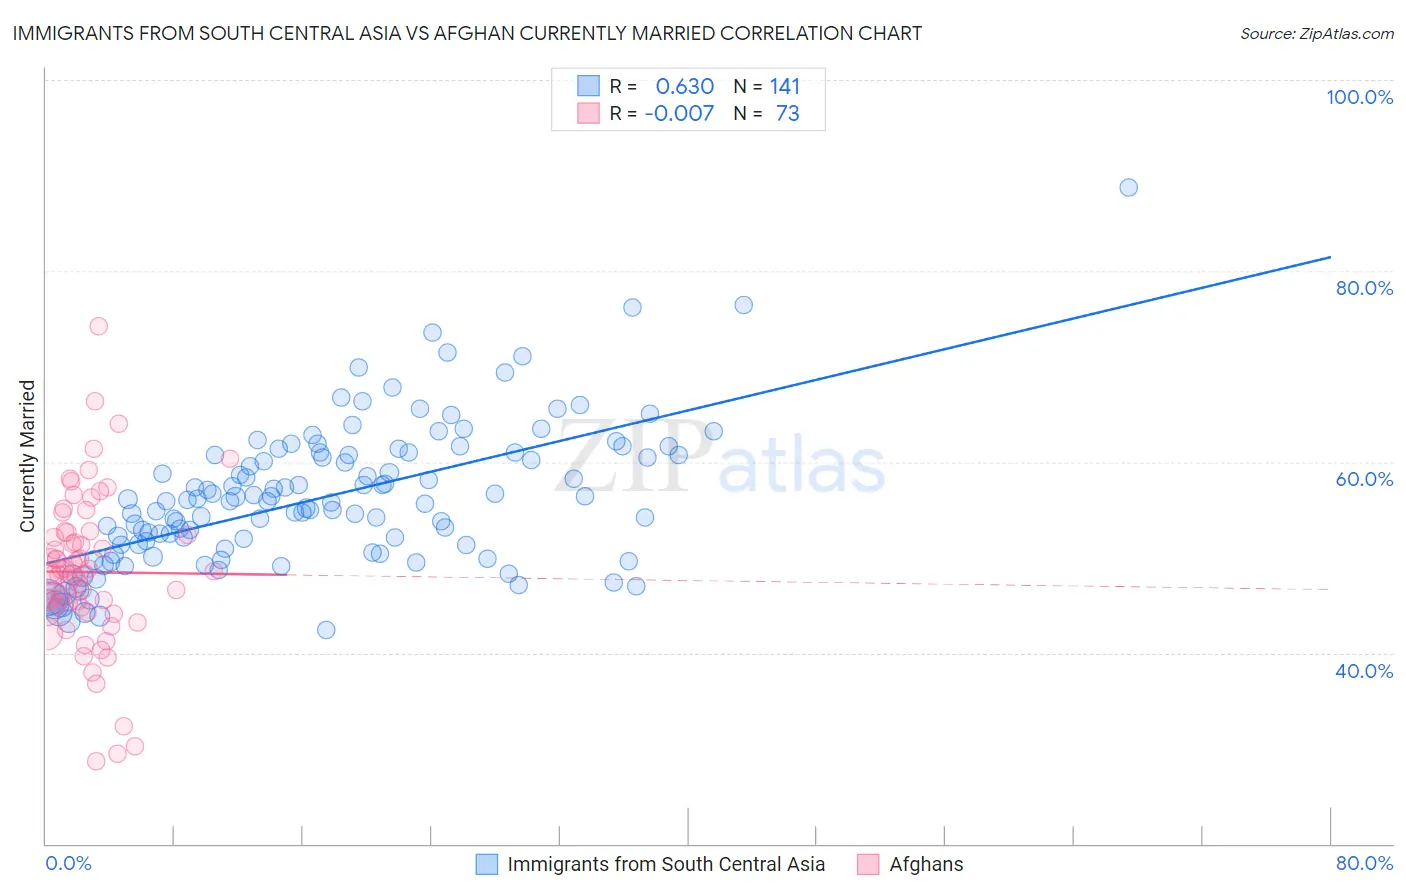
Immigrants from South Central Asia vs Afghan Currently Married Correlation Chart
The statistical analysis conducted on geographies consisting of 473,021,987 people shows a significant positive correlation between the proportion of Immigrants from South Central Asia and percentage of population currently married in the United States with a correlation coefficient (R) of 0.630 and weighted average of 50.0%. Similarly, the statistical analysis conducted on geographies consisting of 148,861,336 people shows no correlation between the proportion of Afghans and percentage of population currently married in the United States with a correlation coefficient (R) of -0.007 and weighted average of 47.3%, a difference of 5.8%.
Currently Married Correlation Summary
| Measurement | Immigrants from South Central Asia | Afghan |
| Minimum | 42.4% | 28.6% |
| Maximum | 88.7% | 74.2% |
| Range | 46.3% | 45.6% |
| Mean | 56.2% | 48.5% |
| Median | 55.8% | 48.3% |
| Interquartile 25% (IQ1) | 50.7% | 44.5% |
| Interquartile 75% (IQ3) | 60.7% | 52.5% |
| Interquartile Range (IQR) | 10.0% | 8.0% |
| Standard Deviation (Sample) | 7.4% | 8.0% |
| Standard Deviation (Population) | 7.4% | 7.9% |
Similar Demographics by Currently Married
Demographics Similar to Immigrants from South Central Asia by Currently Married
In terms of currently married, the demographic groups most similar to Immigrants from South Central Asia are Swedish (50.0%, a difference of 0.13%), Czech (49.9%, a difference of 0.32%), Norwegian (50.2%, a difference of 0.34%), Filipino (49.7%, a difference of 0.58%), and English (49.7%, a difference of 0.59%).
| Demographics | Rating | Rank | Currently Married |
| Immigrants | India | 100.0 /100 | #1 | Exceptional 51.8% |
| Thais | 100.0 /100 | #2 | Exceptional 50.9% |
| Assyrians/Chaldeans/Syriacs | 100.0 /100 | #3 | Exceptional 50.8% |
| Immigrants | Taiwan | 100.0 /100 | #4 | Exceptional 50.7% |
| Danes | 100.0 /100 | #5 | Exceptional 50.5% |
| Norwegians | 100.0 /100 | #6 | Exceptional 50.2% |
| Immigrants | South Central Asia | 100.0 /100 | #7 | Exceptional 50.0% |
| Swedes | 100.0 /100 | #8 | Exceptional 50.0% |
| Czechs | 99.9 /100 | #9 | Exceptional 49.9% |
| Filipinos | 99.9 /100 | #10 | Exceptional 49.7% |
| English | 99.9 /100 | #11 | Exceptional 49.7% |
| Swiss | 99.9 /100 | #12 | Exceptional 49.7% |
| Dutch | 99.9 /100 | #13 | Exceptional 49.6% |
| Germans | 99.9 /100 | #14 | Exceptional 49.6% |
| Pennsylvania Germans | 99.9 /100 | #15 | Exceptional 49.6% |
Demographics Similar to Afghans by Currently Married
In terms of currently married, the demographic groups most similar to Afghans are Icelander (47.3%, a difference of 0.040%), Immigrants from Malaysia (47.3%, a difference of 0.040%), Immigrants from Australia (47.3%, a difference of 0.050%), Immigrants from Iraq (47.3%, a difference of 0.060%), and Sri Lankan (47.3%, a difference of 0.090%).
| Demographics | Rating | Rank | Currently Married |
| Okinawans | 85.3 /100 | #125 | Excellent 47.4% |
| Immigrants | Jordan | 84.9 /100 | #126 | Excellent 47.4% |
| New Zealanders | 84.9 /100 | #127 | Excellent 47.4% |
| Portuguese | 84.2 /100 | #128 | Excellent 47.3% |
| Sri Lankans | 83.2 /100 | #129 | Excellent 47.3% |
| Immigrants | Iraq | 82.8 /100 | #130 | Excellent 47.3% |
| Icelanders | 82.4 /100 | #131 | Excellent 47.3% |
| Afghans | 81.8 /100 | #132 | Excellent 47.3% |
| Immigrants | Malaysia | 81.1 /100 | #133 | Excellent 47.3% |
| Immigrants | Australia | 81.1 /100 | #134 | Excellent 47.3% |
| Immigrants | Norway | 79.7 /100 | #135 | Good 47.2% |
| Immigrants | Vietnam | 78.2 /100 | #136 | Good 47.2% |
| Paraguayans | 77.8 /100 | #137 | Good 47.2% |
| Pakistanis | 77.5 /100 | #138 | Good 47.2% |
| Yugoslavians | 77.4 /100 | #139 | Good 47.2% |