Chilean vs Afghan Currently Married
COMPARE
Chilean
Afghan
Currently Married
Currently Married Comparison
Chileans
Afghans
47.0%
CURRENTLY MARRIED
69.8/ 100
METRIC RATING
151st/ 347
METRIC RANK
47.3%
CURRENTLY MARRIED
81.8/ 100
METRIC RATING
132nd/ 347
METRIC RANK
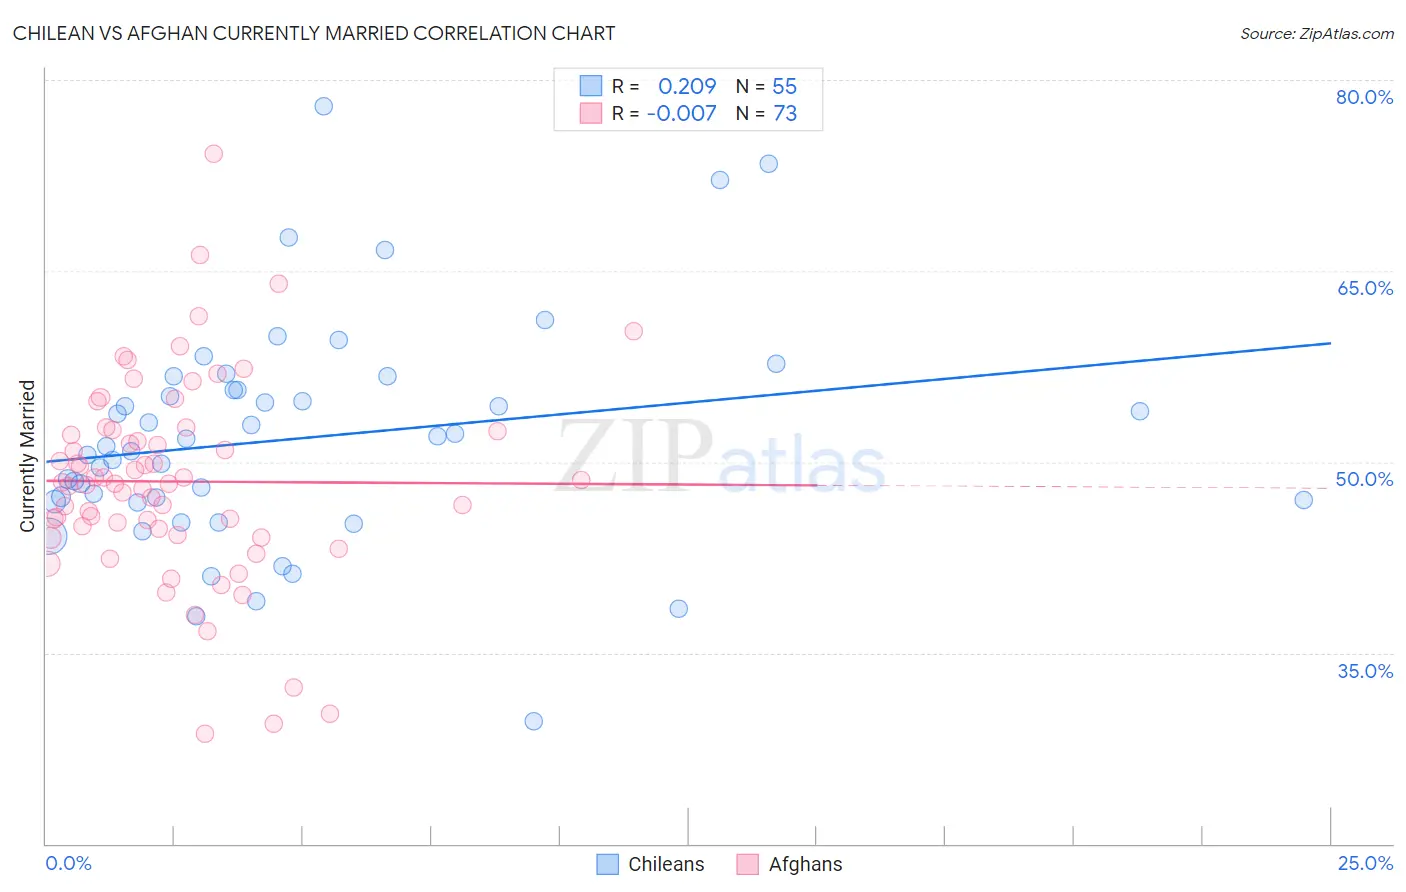
Chilean vs Afghan Currently Married Correlation Chart
The statistical analysis conducted on geographies consisting of 256,662,716 people shows a weak positive correlation between the proportion of Chileans and percentage of population currently married in the United States with a correlation coefficient (R) of 0.209 and weighted average of 47.0%. Similarly, the statistical analysis conducted on geographies consisting of 148,861,336 people shows no correlation between the proportion of Afghans and percentage of population currently married in the United States with a correlation coefficient (R) of -0.007 and weighted average of 47.3%, a difference of 0.61%.
Currently Married Correlation Summary
| Measurement | Chilean | Afghan |
| Minimum | 29.6% | 28.6% |
| Maximum | 78.0% | 74.2% |
| Range | 48.4% | 45.6% |
| Mean | 51.8% | 48.5% |
| Median | 51.2% | 48.3% |
| Interquartile 25% (IQ1) | 46.9% | 44.5% |
| Interquartile 75% (IQ3) | 55.6% | 52.5% |
| Interquartile Range (IQR) | 8.7% | 8.0% |
| Standard Deviation (Sample) | 8.9% | 8.0% |
| Standard Deviation (Population) | 8.8% | 7.9% |
Demographics Similar to Chileans and Afghans by Currently Married
In terms of currently married, the demographic groups most similar to Chileans are Zimbabwean (47.0%, a difference of 0.010%), Immigrants from Turkey (47.0%, a difference of 0.010%), Cambodian (47.0%, a difference of 0.030%), Immigrants from Argentina (47.0%, a difference of 0.10%), and Carpatho Rusyn (47.0%, a difference of 0.13%). Similarly, the demographic groups most similar to Afghans are Icelander (47.3%, a difference of 0.040%), Immigrants from Malaysia (47.3%, a difference of 0.040%), Immigrants from Australia (47.3%, a difference of 0.050%), Immigrants from Norway (47.2%, a difference of 0.13%), and Immigrants from Vietnam (47.2%, a difference of 0.20%).
| Demographics | Rating | Rank | Currently Married |
| Icelanders | 82.4 /100 | #131 | Excellent 47.3% |
| Afghans | 81.8 /100 | #132 | Excellent 47.3% |
| Immigrants | Malaysia | 81.1 /100 | #133 | Excellent 47.3% |
| Immigrants | Australia | 81.1 /100 | #134 | Excellent 47.3% |
| Immigrants | Norway | 79.7 /100 | #135 | Good 47.2% |
| Immigrants | Vietnam | 78.2 /100 | #136 | Good 47.2% |
| Paraguayans | 77.8 /100 | #137 | Good 47.2% |
| Pakistanis | 77.5 /100 | #138 | Good 47.2% |
| Yugoslavians | 77.4 /100 | #139 | Good 47.2% |
| Cajuns | 75.3 /100 | #140 | Good 47.1% |
| Venezuelans | 74.4 /100 | #141 | Good 47.1% |
| Argentineans | 74.4 /100 | #142 | Good 47.1% |
| Guamanians/Chamorros | 74.2 /100 | #143 | Good 47.1% |
| Hmong | 73.4 /100 | #144 | Good 47.1% |
| Immigrants | South Eastern Asia | 72.9 /100 | #145 | Good 47.1% |
| Carpatho Rusyns | 72.6 /100 | #146 | Good 47.0% |
| Immigrants | Argentina | 72.0 /100 | #147 | Good 47.0% |
| Cambodians | 70.4 /100 | #148 | Good 47.0% |
| Zimbabweans | 70.1 /100 | #149 | Good 47.0% |
| Immigrants | Turkey | 70.0 /100 | #150 | Good 47.0% |
| Chileans | 69.8 /100 | #151 | Good 47.0% |