Dominican vs Hungarian Currently Married
COMPARE
Dominican
Hungarian
Currently Married
Currently Married Comparison
Dominicans
Hungarians
39.5%
CURRENTLY MARRIED
0.0/ 100
METRIC RATING
339th/ 347
METRIC RANK
48.8%
CURRENTLY MARRIED
99.4/ 100
METRIC RATING
37th/ 347
METRIC RANK
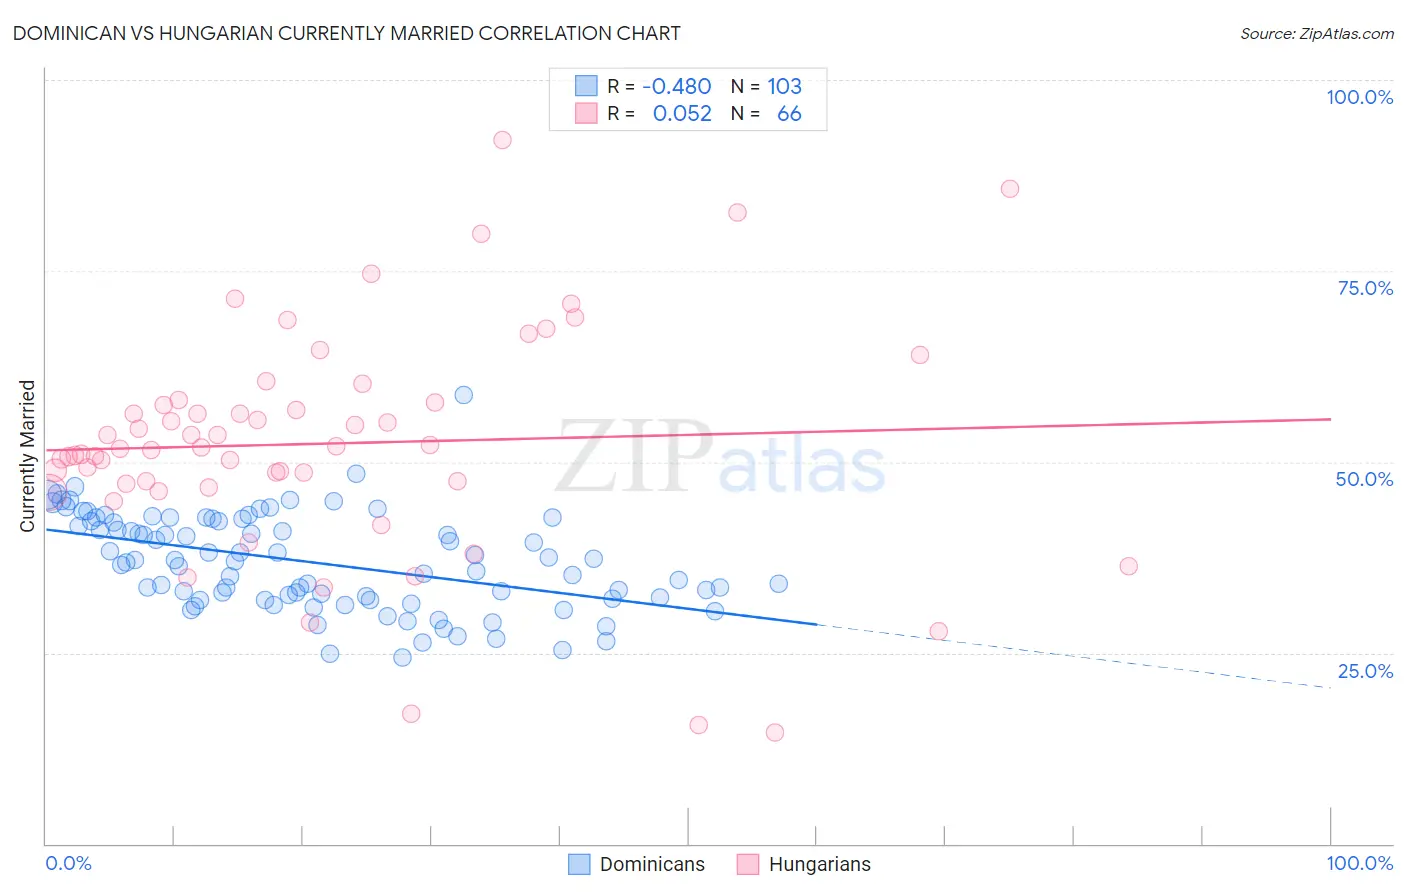
Dominican vs Hungarian Currently Married Correlation Chart
The statistical analysis conducted on geographies consisting of 355,078,950 people shows a moderate negative correlation between the proportion of Dominicans and percentage of population currently married in the United States with a correlation coefficient (R) of -0.480 and weighted average of 39.5%. Similarly, the statistical analysis conducted on geographies consisting of 486,182,197 people shows a slight positive correlation between the proportion of Hungarians and percentage of population currently married in the United States with a correlation coefficient (R) of 0.052 and weighted average of 48.8%, a difference of 23.6%.
Currently Married Correlation Summary
| Measurement | Dominican | Hungarian |
| Minimum | 24.4% | 14.5% |
| Maximum | 58.8% | 92.1% |
| Range | 34.4% | 77.6% |
| Mean | 36.9% | 52.4% |
| Median | 37.0% | 51.8% |
| Interquartile 25% (IQ1) | 32.2% | 47.1% |
| Interquartile 75% (IQ3) | 42.3% | 57.7% |
| Interquartile Range (IQR) | 10.1% | 10.6% |
| Standard Deviation (Sample) | 6.3% | 14.9% |
| Standard Deviation (Population) | 6.2% | 14.7% |
Similar Demographics by Currently Married
Demographics Similar to Dominicans by Currently Married
In terms of currently married, the demographic groups most similar to Dominicans are Cape Verdean (39.6%, a difference of 0.15%), Black/African American (39.6%, a difference of 0.25%), British West Indian (39.8%, a difference of 0.63%), Lumbee (39.8%, a difference of 0.80%), and Immigrants from Grenada (39.1%, a difference of 0.96%).
| Demographics | Rating | Rank | Currently Married |
| Immigrants | St. Vincent and the Grenadines | 0.0 /100 | #332 | Tragic 40.1% |
| Yup'ik | 0.0 /100 | #333 | Tragic 39.9% |
| Puerto Ricans | 0.0 /100 | #334 | Tragic 39.9% |
| Lumbee | 0.0 /100 | #335 | Tragic 39.8% |
| British West Indians | 0.0 /100 | #336 | Tragic 39.8% |
| Blacks/African Americans | 0.0 /100 | #337 | Tragic 39.6% |
| Cape Verdeans | 0.0 /100 | #338 | Tragic 39.6% |
| Dominicans | 0.0 /100 | #339 | Tragic 39.5% |
| Immigrants | Grenada | 0.0 /100 | #340 | Tragic 39.1% |
| Navajo | 0.0 /100 | #341 | Tragic 39.0% |
| Immigrants | Dominican Republic | 0.0 /100 | #342 | Tragic 38.9% |
| Pueblo | 0.0 /100 | #343 | Tragic 38.2% |
| Immigrants | Cabo Verde | 0.0 /100 | #344 | Tragic 37.8% |
| Tohono O'odham | 0.0 /100 | #345 | Tragic 36.8% |
| Hopi | 0.0 /100 | #346 | Tragic 36.5% |
Demographics Similar to Hungarians by Currently Married
In terms of currently married, the demographic groups most similar to Hungarians are Italian (48.8%, a difference of 0.0%), Immigrants from Northern Europe (48.8%, a difference of 0.010%), Immigrants from Lithuania (48.8%, a difference of 0.030%), Czechoslovakian (48.8%, a difference of 0.040%), and British (48.8%, a difference of 0.070%).
| Demographics | Rating | Rank | Currently Married |
| Eastern Europeans | 99.5 /100 | #30 | Exceptional 48.9% |
| Poles | 99.5 /100 | #31 | Exceptional 48.9% |
| Immigrants | Hong Kong | 99.5 /100 | #32 | Exceptional 48.9% |
| Irish | 99.5 /100 | #33 | Exceptional 48.9% |
| Immigrants | Lithuania | 99.4 /100 | #34 | Exceptional 48.8% |
| Immigrants | Northern Europe | 99.4 /100 | #35 | Exceptional 48.8% |
| Italians | 99.4 /100 | #36 | Exceptional 48.8% |
| Hungarians | 99.4 /100 | #37 | Exceptional 48.8% |
| Czechoslovakians | 99.4 /100 | #38 | Exceptional 48.8% |
| British | 99.4 /100 | #39 | Exceptional 48.8% |
| Immigrants | Canada | 99.4 /100 | #40 | Exceptional 48.8% |
| Greeks | 99.3 /100 | #41 | Exceptional 48.8% |
| Finns | 99.3 /100 | #42 | Exceptional 48.8% |
| Scotch-Irish | 99.3 /100 | #43 | Exceptional 48.7% |
| Immigrants | North America | 99.3 /100 | #44 | Exceptional 48.7% |