Creek vs Afghan Currently Married
COMPARE
Creek
Afghan
Currently Married
Currently Married Comparison
Creek
Afghans
46.0%
CURRENTLY MARRIED
17.2/ 100
METRIC RATING
200th/ 347
METRIC RANK
47.3%
CURRENTLY MARRIED
81.8/ 100
METRIC RATING
132nd/ 347
METRIC RANK
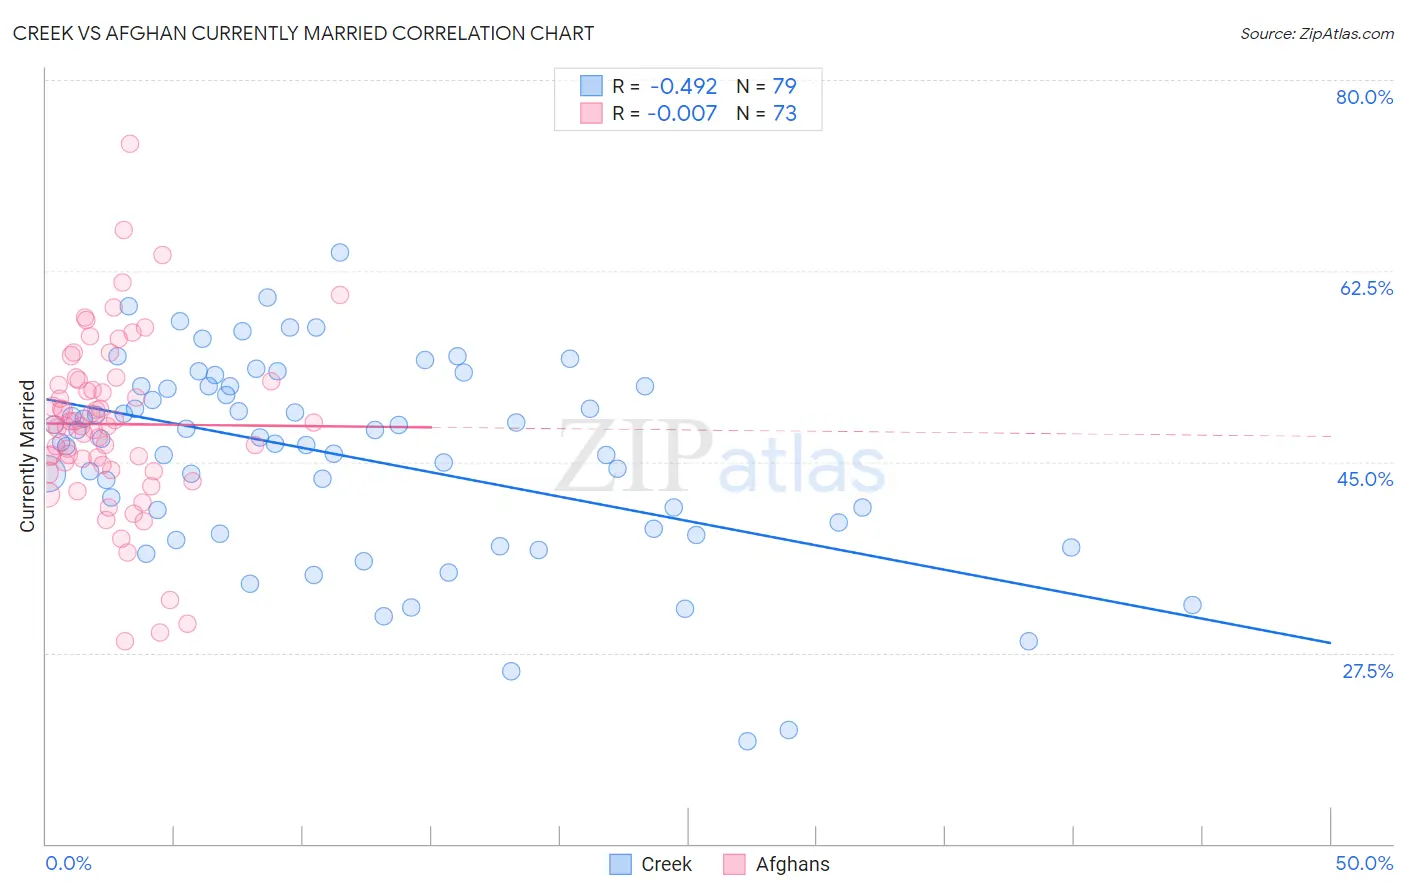
Creek vs Afghan Currently Married Correlation Chart
The statistical analysis conducted on geographies consisting of 178,480,718 people shows a moderate negative correlation between the proportion of Creek and percentage of population currently married in the United States with a correlation coefficient (R) of -0.492 and weighted average of 46.0%. Similarly, the statistical analysis conducted on geographies consisting of 148,861,336 people shows no correlation between the proportion of Afghans and percentage of population currently married in the United States with a correlation coefficient (R) of -0.007 and weighted average of 47.3%, a difference of 2.9%.
Currently Married Correlation Summary
| Measurement | Creek | Afghan |
| Minimum | 19.4% | 28.6% |
| Maximum | 64.2% | 74.2% |
| Range | 44.8% | 45.6% |
| Mean | 45.4% | 48.5% |
| Median | 47.1% | 48.3% |
| Interquartile 25% (IQ1) | 38.8% | 44.5% |
| Interquartile 75% (IQ3) | 51.9% | 52.5% |
| Interquartile Range (IQR) | 13.1% | 8.0% |
| Standard Deviation (Sample) | 9.0% | 8.0% |
| Standard Deviation (Population) | 9.0% | 7.9% |
Similar Demographics by Currently Married
Demographics Similar to Creek by Currently Married
In terms of currently married, the demographic groups most similar to Creek are Malaysian (45.9%, a difference of 0.13%), Immigrants from Costa Rica (46.0%, a difference of 0.14%), Immigrants from Albania (45.9%, a difference of 0.19%), Immigrants from Colombia (46.1%, a difference of 0.22%), and Immigrants from Kuwait (46.1%, a difference of 0.26%).
| Demographics | Rating | Rank | Currently Married |
| Immigrants | Fiji | 25.0 /100 | #193 | Fair 46.2% |
| South Americans | 23.8 /100 | #194 | Fair 46.1% |
| Immigrants | Nepal | 23.7 /100 | #195 | Fair 46.1% |
| Immigrants | Bosnia and Herzegovina | 22.2 /100 | #196 | Fair 46.1% |
| Immigrants | Kuwait | 21.7 /100 | #197 | Fair 46.1% |
| Immigrants | Colombia | 21.0 /100 | #198 | Fair 46.1% |
| Immigrants | Costa Rica | 19.6 /100 | #199 | Poor 46.0% |
| Creek | 17.2 /100 | #200 | Poor 46.0% |
| Malaysians | 15.3 /100 | #201 | Poor 45.9% |
| Immigrants | Albania | 14.5 /100 | #202 | Poor 45.9% |
| Taiwanese | 11.7 /100 | #203 | Poor 45.8% |
| Immigrants | Spain | 11.6 /100 | #204 | Poor 45.8% |
| South American Indians | 11.5 /100 | #205 | Poor 45.8% |
| Immigrants | Immigrants | 11.2 /100 | #206 | Poor 45.8% |
| Immigrants | South America | 10.8 /100 | #207 | Poor 45.7% |
Demographics Similar to Afghans by Currently Married
In terms of currently married, the demographic groups most similar to Afghans are Icelander (47.3%, a difference of 0.040%), Immigrants from Malaysia (47.3%, a difference of 0.040%), Immigrants from Australia (47.3%, a difference of 0.050%), Immigrants from Iraq (47.3%, a difference of 0.060%), and Sri Lankan (47.3%, a difference of 0.090%).
| Demographics | Rating | Rank | Currently Married |
| Okinawans | 85.3 /100 | #125 | Excellent 47.4% |
| Immigrants | Jordan | 84.9 /100 | #126 | Excellent 47.4% |
| New Zealanders | 84.9 /100 | #127 | Excellent 47.4% |
| Portuguese | 84.2 /100 | #128 | Excellent 47.3% |
| Sri Lankans | 83.2 /100 | #129 | Excellent 47.3% |
| Immigrants | Iraq | 82.8 /100 | #130 | Excellent 47.3% |
| Icelanders | 82.4 /100 | #131 | Excellent 47.3% |
| Afghans | 81.8 /100 | #132 | Excellent 47.3% |
| Immigrants | Malaysia | 81.1 /100 | #133 | Excellent 47.3% |
| Immigrants | Australia | 81.1 /100 | #134 | Excellent 47.3% |
| Immigrants | Norway | 79.7 /100 | #135 | Good 47.2% |
| Immigrants | Vietnam | 78.2 /100 | #136 | Good 47.2% |
| Paraguayans | 77.8 /100 | #137 | Good 47.2% |
| Pakistanis | 77.5 /100 | #138 | Good 47.2% |
| Yugoslavians | 77.4 /100 | #139 | Good 47.2% |