Dominican vs Afghan No Vehicles in Household
COMPARE
Dominican
Afghan
No Vehicles in Household
No Vehicles in Household Comparison
Dominicans
Afghans
29.4%
NO VEHICLES IN HOUSEHOLD
0.0/ 100
METRIC RATING
339th/ 347
METRIC RANK
8.0%
NO VEHICLES IN HOUSEHOLD
99.9/ 100
METRIC RATING
48th/ 347
METRIC RANK
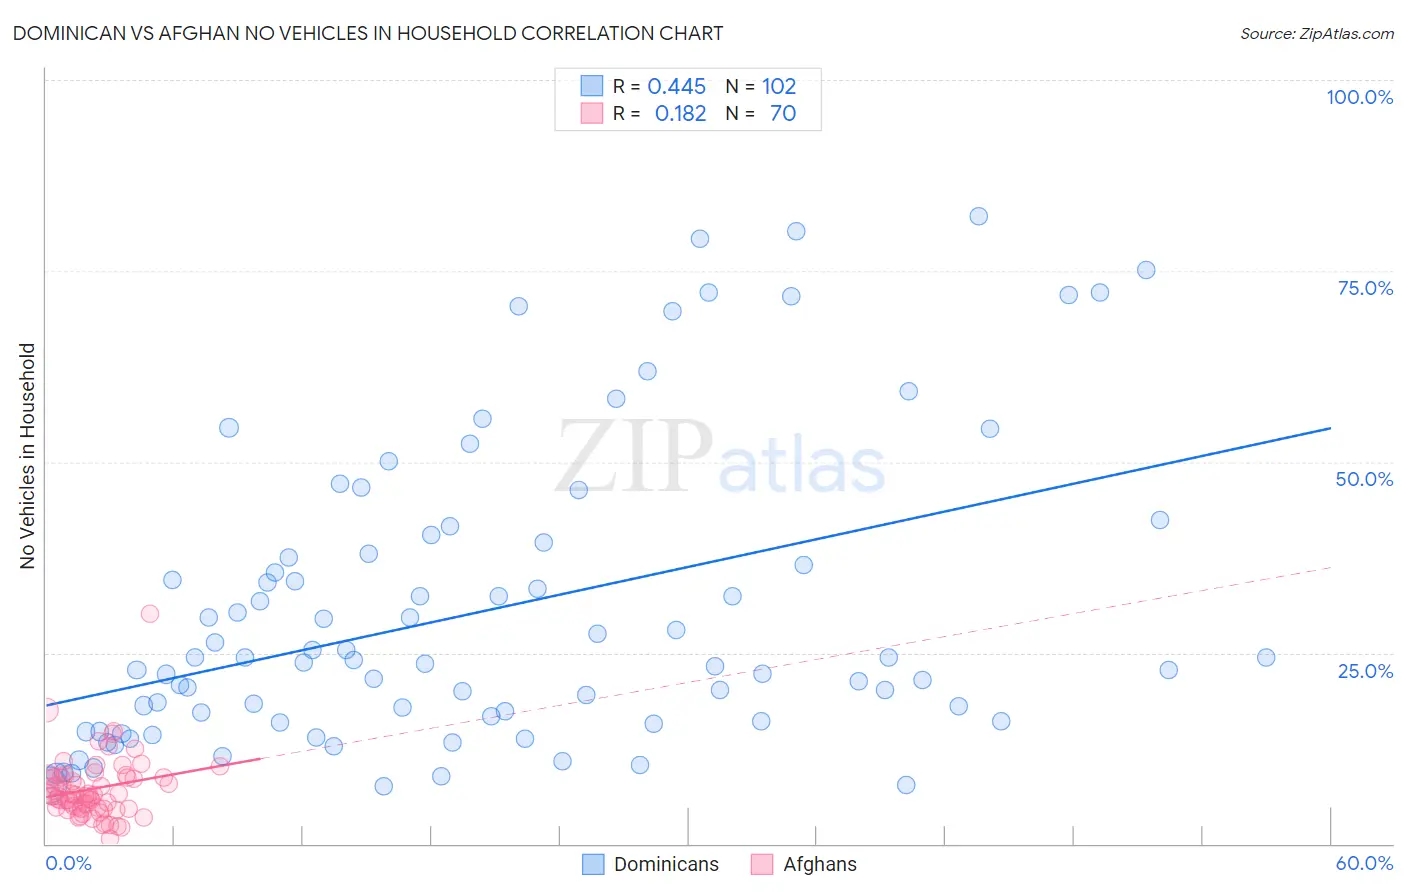
Dominican vs Afghan No Vehicles in Household Correlation Chart
The statistical analysis conducted on geographies consisting of 354,220,485 people shows a moderate positive correlation between the proportion of Dominicans and percentage of households with no vehicle available in the United States with a correlation coefficient (R) of 0.445 and weighted average of 29.4%. Similarly, the statistical analysis conducted on geographies consisting of 148,777,308 people shows a poor positive correlation between the proportion of Afghans and percentage of households with no vehicle available in the United States with a correlation coefficient (R) of 0.182 and weighted average of 8.0%, a difference of 269.1%.
No Vehicles in Household Correlation Summary
| Measurement | Dominican | Afghan |
| Minimum | 7.6% | 0.64% |
| Maximum | 82.1% | 30.1% |
| Range | 74.5% | 29.5% |
| Mean | 30.4% | 7.2% |
| Median | 23.8% | 6.3% |
| Interquartile 25% (IQ1) | 16.0% | 4.7% |
| Interquartile 75% (IQ3) | 38.0% | 8.7% |
| Interquartile Range (IQR) | 22.0% | 4.0% |
| Standard Deviation (Sample) | 19.5% | 4.3% |
| Standard Deviation (Population) | 19.4% | 4.2% |
Similar Demographics by No Vehicles in Household
Demographics Similar to Dominicans by No Vehicles in Household
In terms of no vehicles in household, the demographic groups most similar to Dominicans are Immigrants from Barbados (29.5%, a difference of 0.23%), Immigrants from Guyana (29.5%, a difference of 0.28%), Guyanese (29.3%, a difference of 0.36%), British West Indian (29.7%, a difference of 1.1%), and Inupiat (29.9%, a difference of 1.5%).
| Demographics | Rating | Rank | No Vehicles in Household |
| Immigrants | Ecuador | 0.0 /100 | #332 | Tragic 23.8% |
| Immigrants | Trinidad and Tobago | 0.0 /100 | #333 | Tragic 24.6% |
| Immigrants | Bangladesh | 0.0 /100 | #334 | Tragic 25.8% |
| Barbadians | 0.0 /100 | #335 | Tragic 26.1% |
| Vietnamese | 0.0 /100 | #336 | Tragic 26.2% |
| Immigrants | Uzbekistan | 0.0 /100 | #337 | Tragic 26.7% |
| Guyanese | 0.0 /100 | #338 | Tragic 29.3% |
| Dominicans | 0.0 /100 | #339 | Tragic 29.4% |
| Immigrants | Barbados | 0.0 /100 | #340 | Tragic 29.5% |
| Immigrants | Guyana | 0.0 /100 | #341 | Tragic 29.5% |
| British West Indians | 0.0 /100 | #342 | Tragic 29.7% |
| Inupiat | 0.0 /100 | #343 | Tragic 29.9% |
| Immigrants | Dominican Republic | 0.0 /100 | #344 | Tragic 31.4% |
| Immigrants | St. Vincent and the Grenadines | 0.0 /100 | #345 | Tragic 35.4% |
| Immigrants | Grenada | 0.0 /100 | #346 | Tragic 37.5% |
Demographics Similar to Afghans by No Vehicles in Household
In terms of no vehicles in household, the demographic groups most similar to Afghans are Guamanian/Chamorro (8.0%, a difference of 0.17%), Belgian (8.0%, a difference of 0.25%), Korean (8.0%, a difference of 0.34%), Northern European (7.9%, a difference of 0.47%), and Spanish (7.9%, a difference of 0.59%).
| Demographics | Rating | Rank | No Vehicles in Household |
| French Canadians | 99.9 /100 | #41 | Exceptional 7.8% |
| Swiss | 99.9 /100 | #42 | Exceptional 7.9% |
| Chickasaw | 99.9 /100 | #43 | Exceptional 7.9% |
| Choctaw | 99.9 /100 | #44 | Exceptional 7.9% |
| Immigrants | Nonimmigrants | 99.9 /100 | #45 | Exceptional 7.9% |
| Spanish | 99.9 /100 | #46 | Exceptional 7.9% |
| Northern Europeans | 99.9 /100 | #47 | Exceptional 7.9% |
| Afghans | 99.9 /100 | #48 | Exceptional 8.0% |
| Guamanians/Chamorros | 99.9 /100 | #49 | Exceptional 8.0% |
| Belgians | 99.9 /100 | #50 | Exceptional 8.0% |
| Koreans | 99.9 /100 | #51 | Exceptional 8.0% |
| Hawaiians | 99.9 /100 | #52 | Exceptional 8.0% |
| Slovenes | 99.9 /100 | #53 | Exceptional 8.0% |
| Immigrants | Venezuela | 99.9 /100 | #54 | Exceptional 8.1% |
| Celtics | 99.9 /100 | #55 | Exceptional 8.1% |